![[Stock] man on laptop](http://images.ctfassets.net/gwbpo1m641r7/4b6DXDFMIjELzOSWUatyco/ef78a6d65e860377f25122f73bfd816e/customer-retention-someone-navigating-on-a-computer-1.jpg?w=3840&q=100&fit=fill&fm=avif)
Your data holds the secrets to improving customer experiences, increasing revenue, and enhancing business operations—but for most companies, those nuggets remain buried due to poor quality, information silos, and low usability.
An effective data management strategy is the key to unlocking this goldmine. With the right strategy, you ensure all data is high quality, connected, and easily accessible, empowering everyone—from execs to business intelligence analysts to marketing teams—to derive valuable insights, make data-driven decisions, and contribute to key business goals.
Read on to learn the 5 steps to creating a data management strategy that helps you transform raw data into real impact, and download our checklist to get started.
Key insights
A data management strategy is a documented plan that outlines how your organization collects, organizes, stores, protects, and uses data to achieve key business goals
A robust data management strategy is essential to ensure your data is secure, compliant, and well-governed. It connects data and makes it easily accessible, enabling every team to make informed decisions, improve customer experiences, and drive better ROI on initiatives.
Digital experience insights are the missing link in many data management strategies. Bringing digital and behavioral insights into your warehouse—and building them into your strategy—gives you a more complete and empathetic understanding of your customers, allowing you to make better predictions and make more empathetic user experience (UX) decisions.
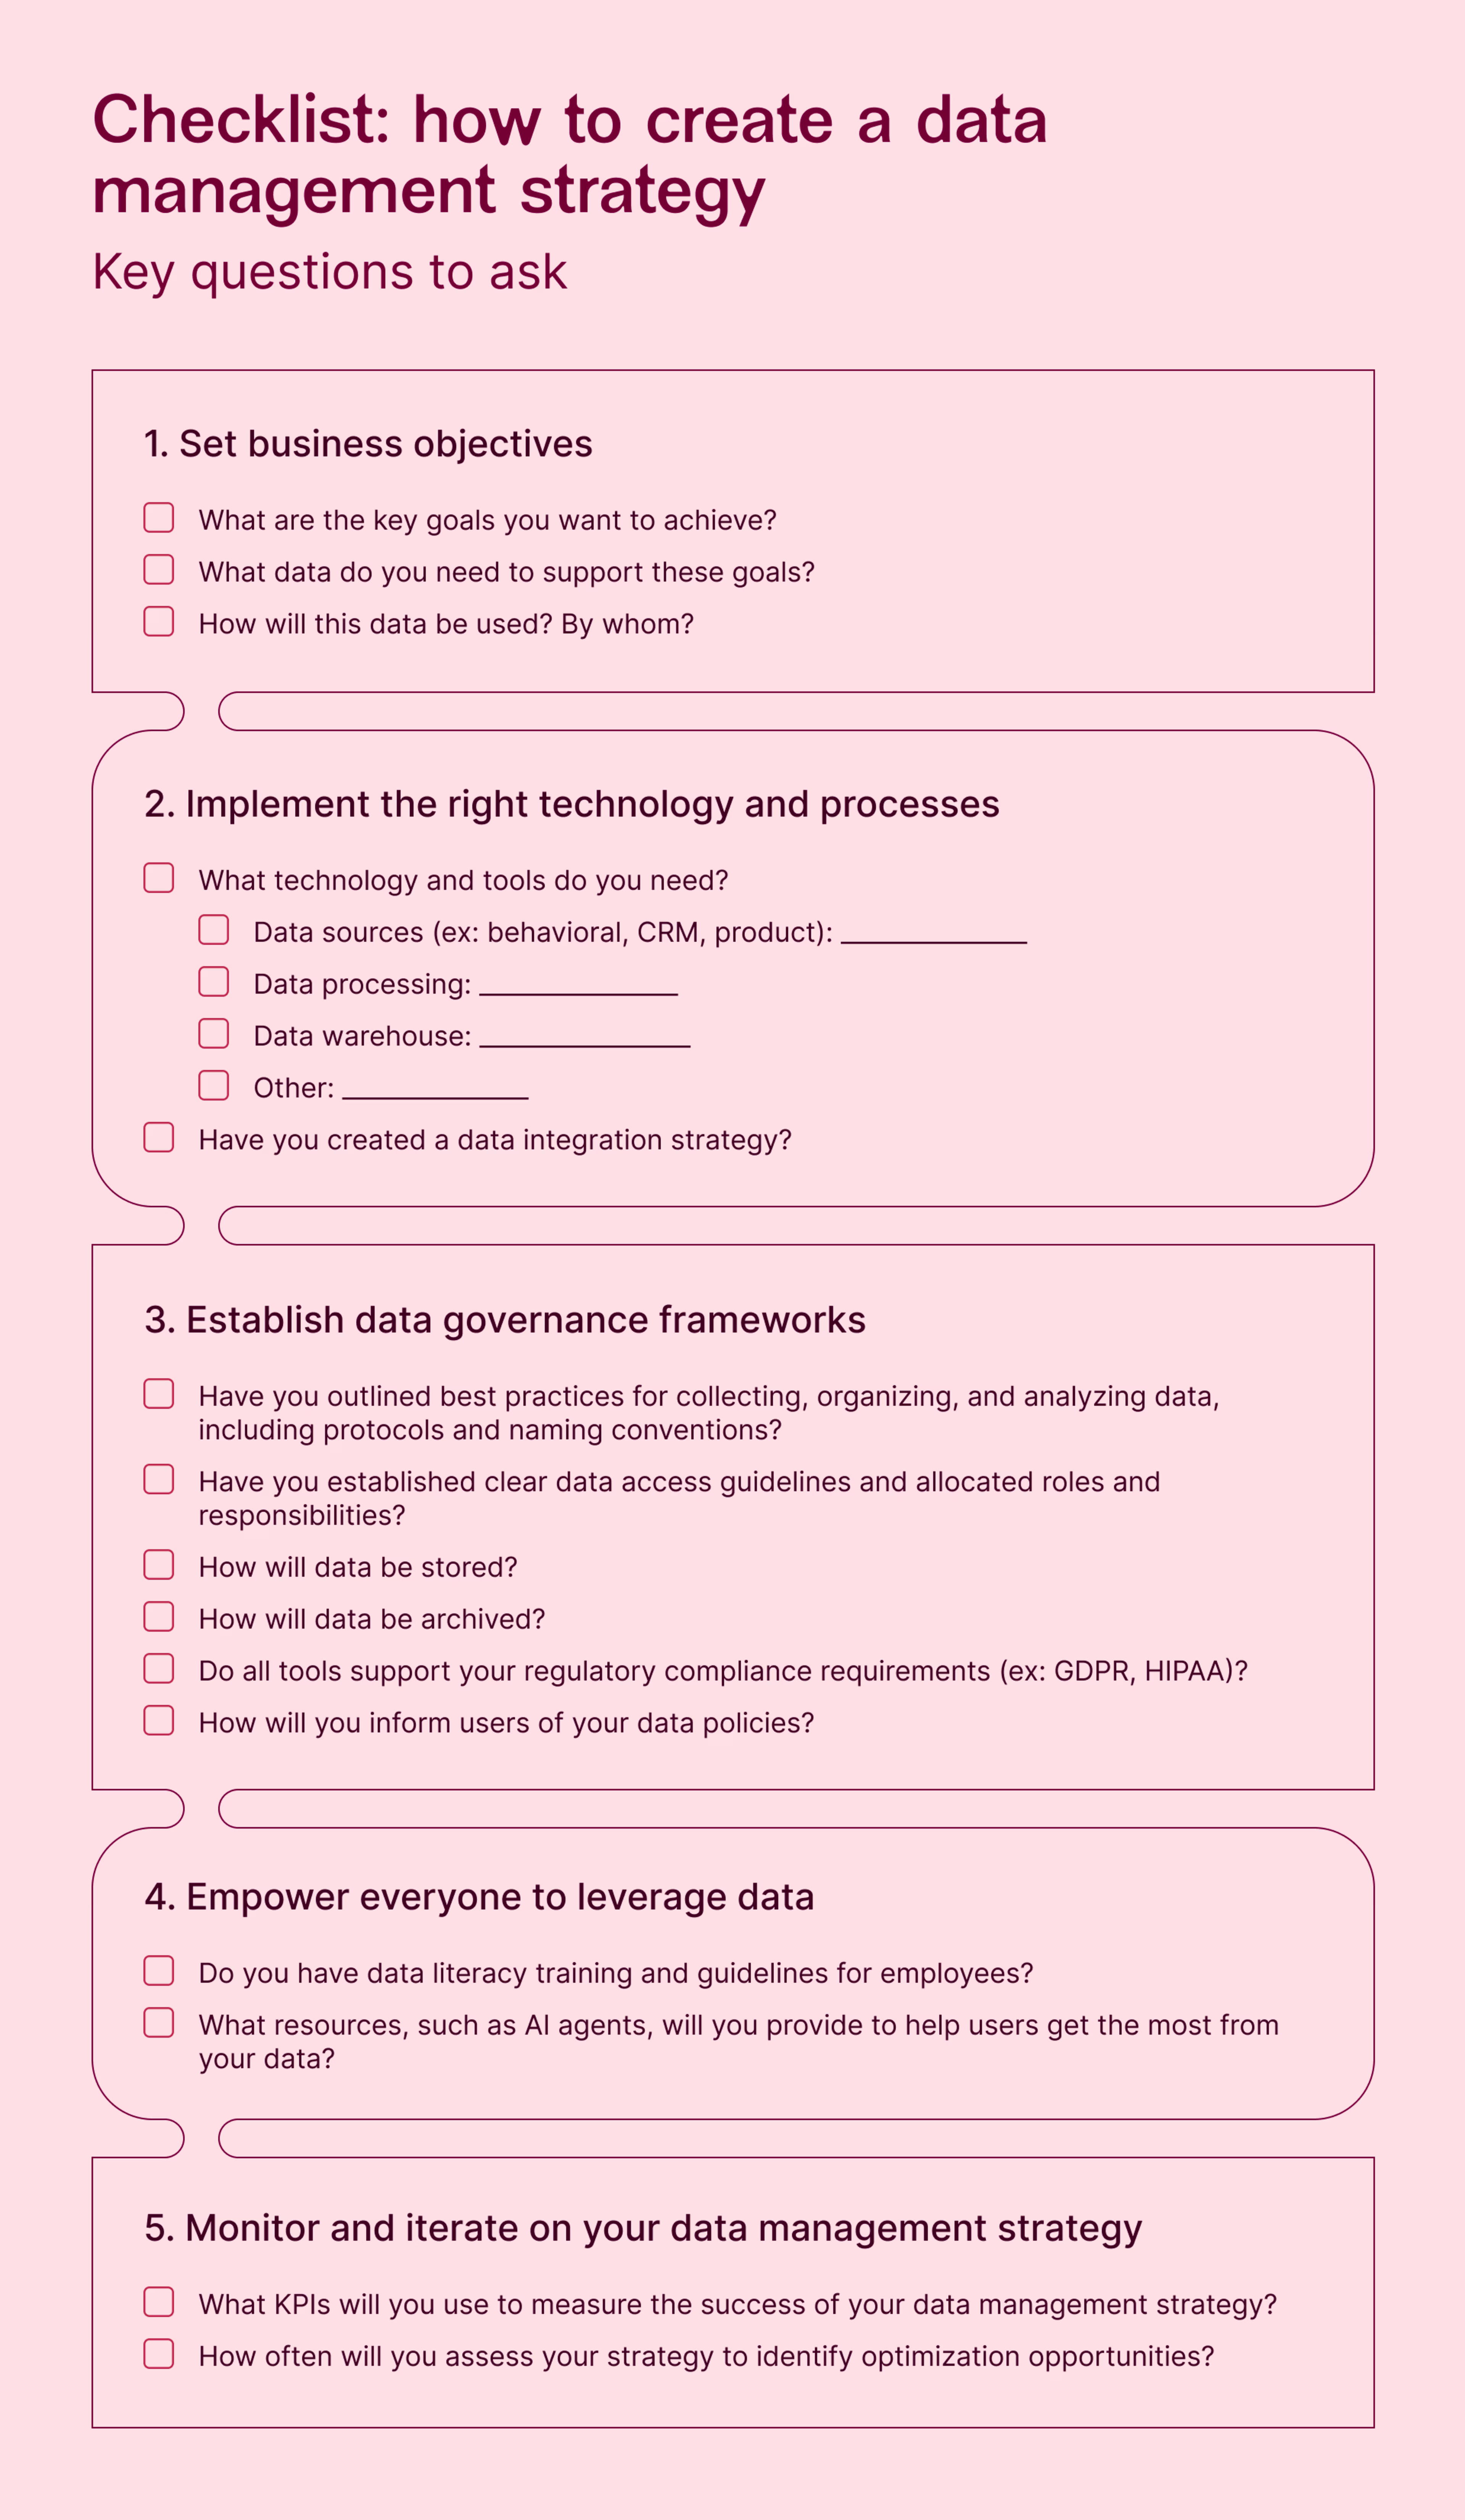
1. Set business objectives
First, define clear business goals to identify what data you need to collect, as well as how it will be used and by whom.
For example, if your business objective is to improve customer experience (CX), collect qualitative and quantitative data from key touchpoints in the user journey across your site, app, or product. You also need to make this data accessible to stakeholders at different levels of the organization—from C-level execs to marketing and product teams—and provide them with the right amount of insights for their needs.
With your goals in mind, outline what data you want to capture. For example, to improve CX, you might collect
Behavioral data from Contentsquare tools like Session Replay, Heatmaps, and Journeys that show how users interact with your site or product
CRM or ecommerce data like customer history, previous transactions, and renewals
Product analytics data that reveal adoption, engagement, and retention patterns
Customer support data like tickets and call logs
When combined, this data gives a comprehensive view of user pain points, needs, and preferences, highlighting moments of user friction that negatively impact CX metrics and the effect this has on KPIs like renewal rates.
💡 Pro tip: with Smart Capture, Contentsquare automatically collects every interaction from day one, without needing complicated tagging or setup—so even if your goals or objectives change, you still have all the data you need.
2. Implement (and integrate) the right technology
Once you know what data you need, you can set up the right data management tools to collect, analyze, and leverage it. The tools you use will be based on the objectives and business needs you defined in Step 1, as well as factors like your organization’s data maturity and budget.
Your data management tech stack may include
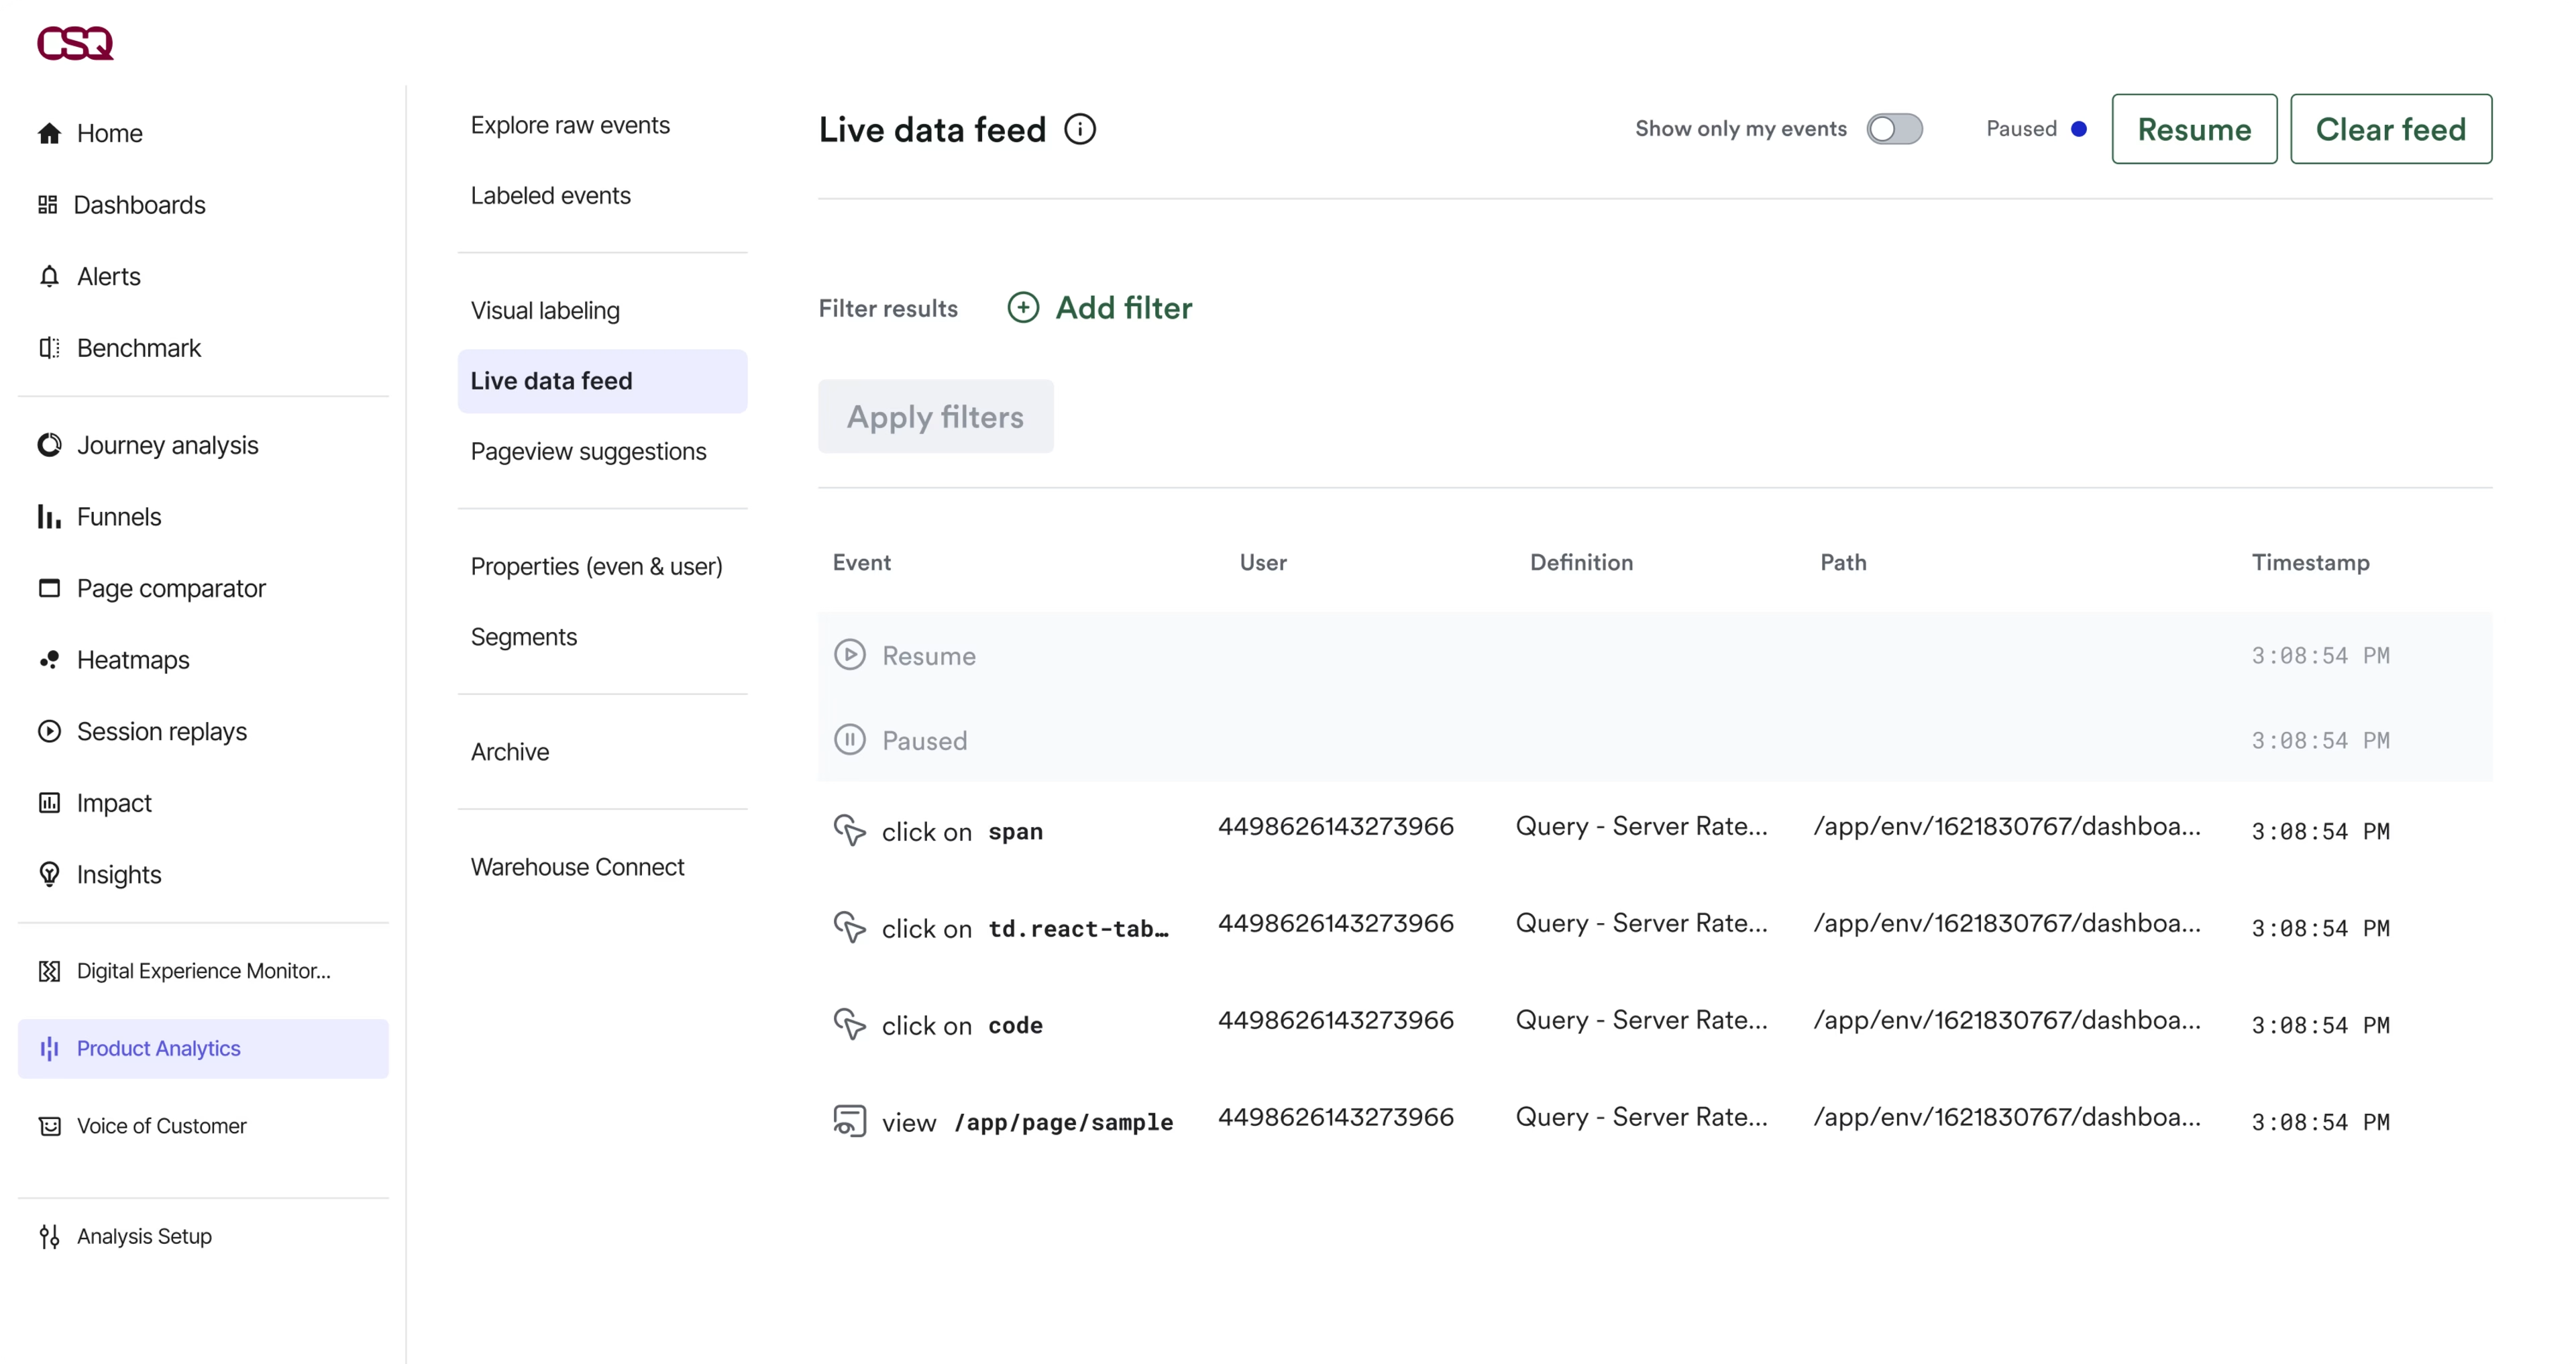
Behavioral data management tools (like Contentsquare 👋) that collect and analyze user behavior and digital experience data
Data processing tools that collect, clean, and transform raw data
A data warehouse that centralizes and stores large volumes of structured data to support querying and analysis
Data modeling and visualization tools that represent data as graphs, tables, or charts to aid with reporting
Data governance tools that embed security and compliance best practices into workflows
These tools must work together to capture data at every stage of the customer journey and break down data silos. Use a data integration strategy to consolidate data from multiple datasets and sources to provide a unified view, uncover real-time insights, and improve operational efficiency.
💡 Pro tip: bring Contentsquare data directly into your warehouse of choice with Data Connect. Data Connect simplifies data enrichment and integration, and delivers high-quality data right where you need it to fuel customer-centric decisions and optimize CX.
![[Visual] Data Connect](http://images.ctfassets.net/gwbpo1m641r7/78lJG8kGk6ifl1DusTJnoS/97013645900ae9f27c85f5aacba535d6/Contentsquare-Data-Connect.svg?w=1920&q=100&fit=fill)
3. Establish data governance frameworks
Ensuring data is clean, reliable, and secure is vital to your business—and maintaining your customers’ trust. Establishing data governance frameworks ensures that everyone across the business knows how to safely collect, manage, and use your organization’s data, promoting best practices and maintaining regulatory compliance.
These frameworks also set the foundations for scalability, empowering your data to grow with your business. This lets you quickly adapt to new challenges and opportunities, like AI-powered capabilities, without compromising security.
Key governance considerations include
Data access: how you control and audit who can access which data assets
Compliance: how your tools and processes meet regulatory requirements for data usage, storage, and retention (like GDPR or HIPAA)
Data quality: how you ensure the completeness, accuracy, consistency, and reliability of your data
Data security: how you secure data against threats and risks, like unauthorized access, theft, data breaches, or corruption
💡 Pro tip: learn how Contentsquare supports your compliance and security efforts in our Privacy-Conscious Analytics Guide.
4. Empower everyone to use data
To get the greatest business value from your data, you need to enable everyone to use it and incorporate data-driven insights into their everyday workflows.
Build democratization and literacy into your data management strategy by
Providing company-wide training programs that teach users how to find and use data effectively
Equipping users with accessible, easy-to-use tools—ideally with built-in AI capabilities like analysts and copilots—that surface immediate, actionable insights and recommend next steps
Using dashboards to align teams and cross-functional business units around key goals and metrics
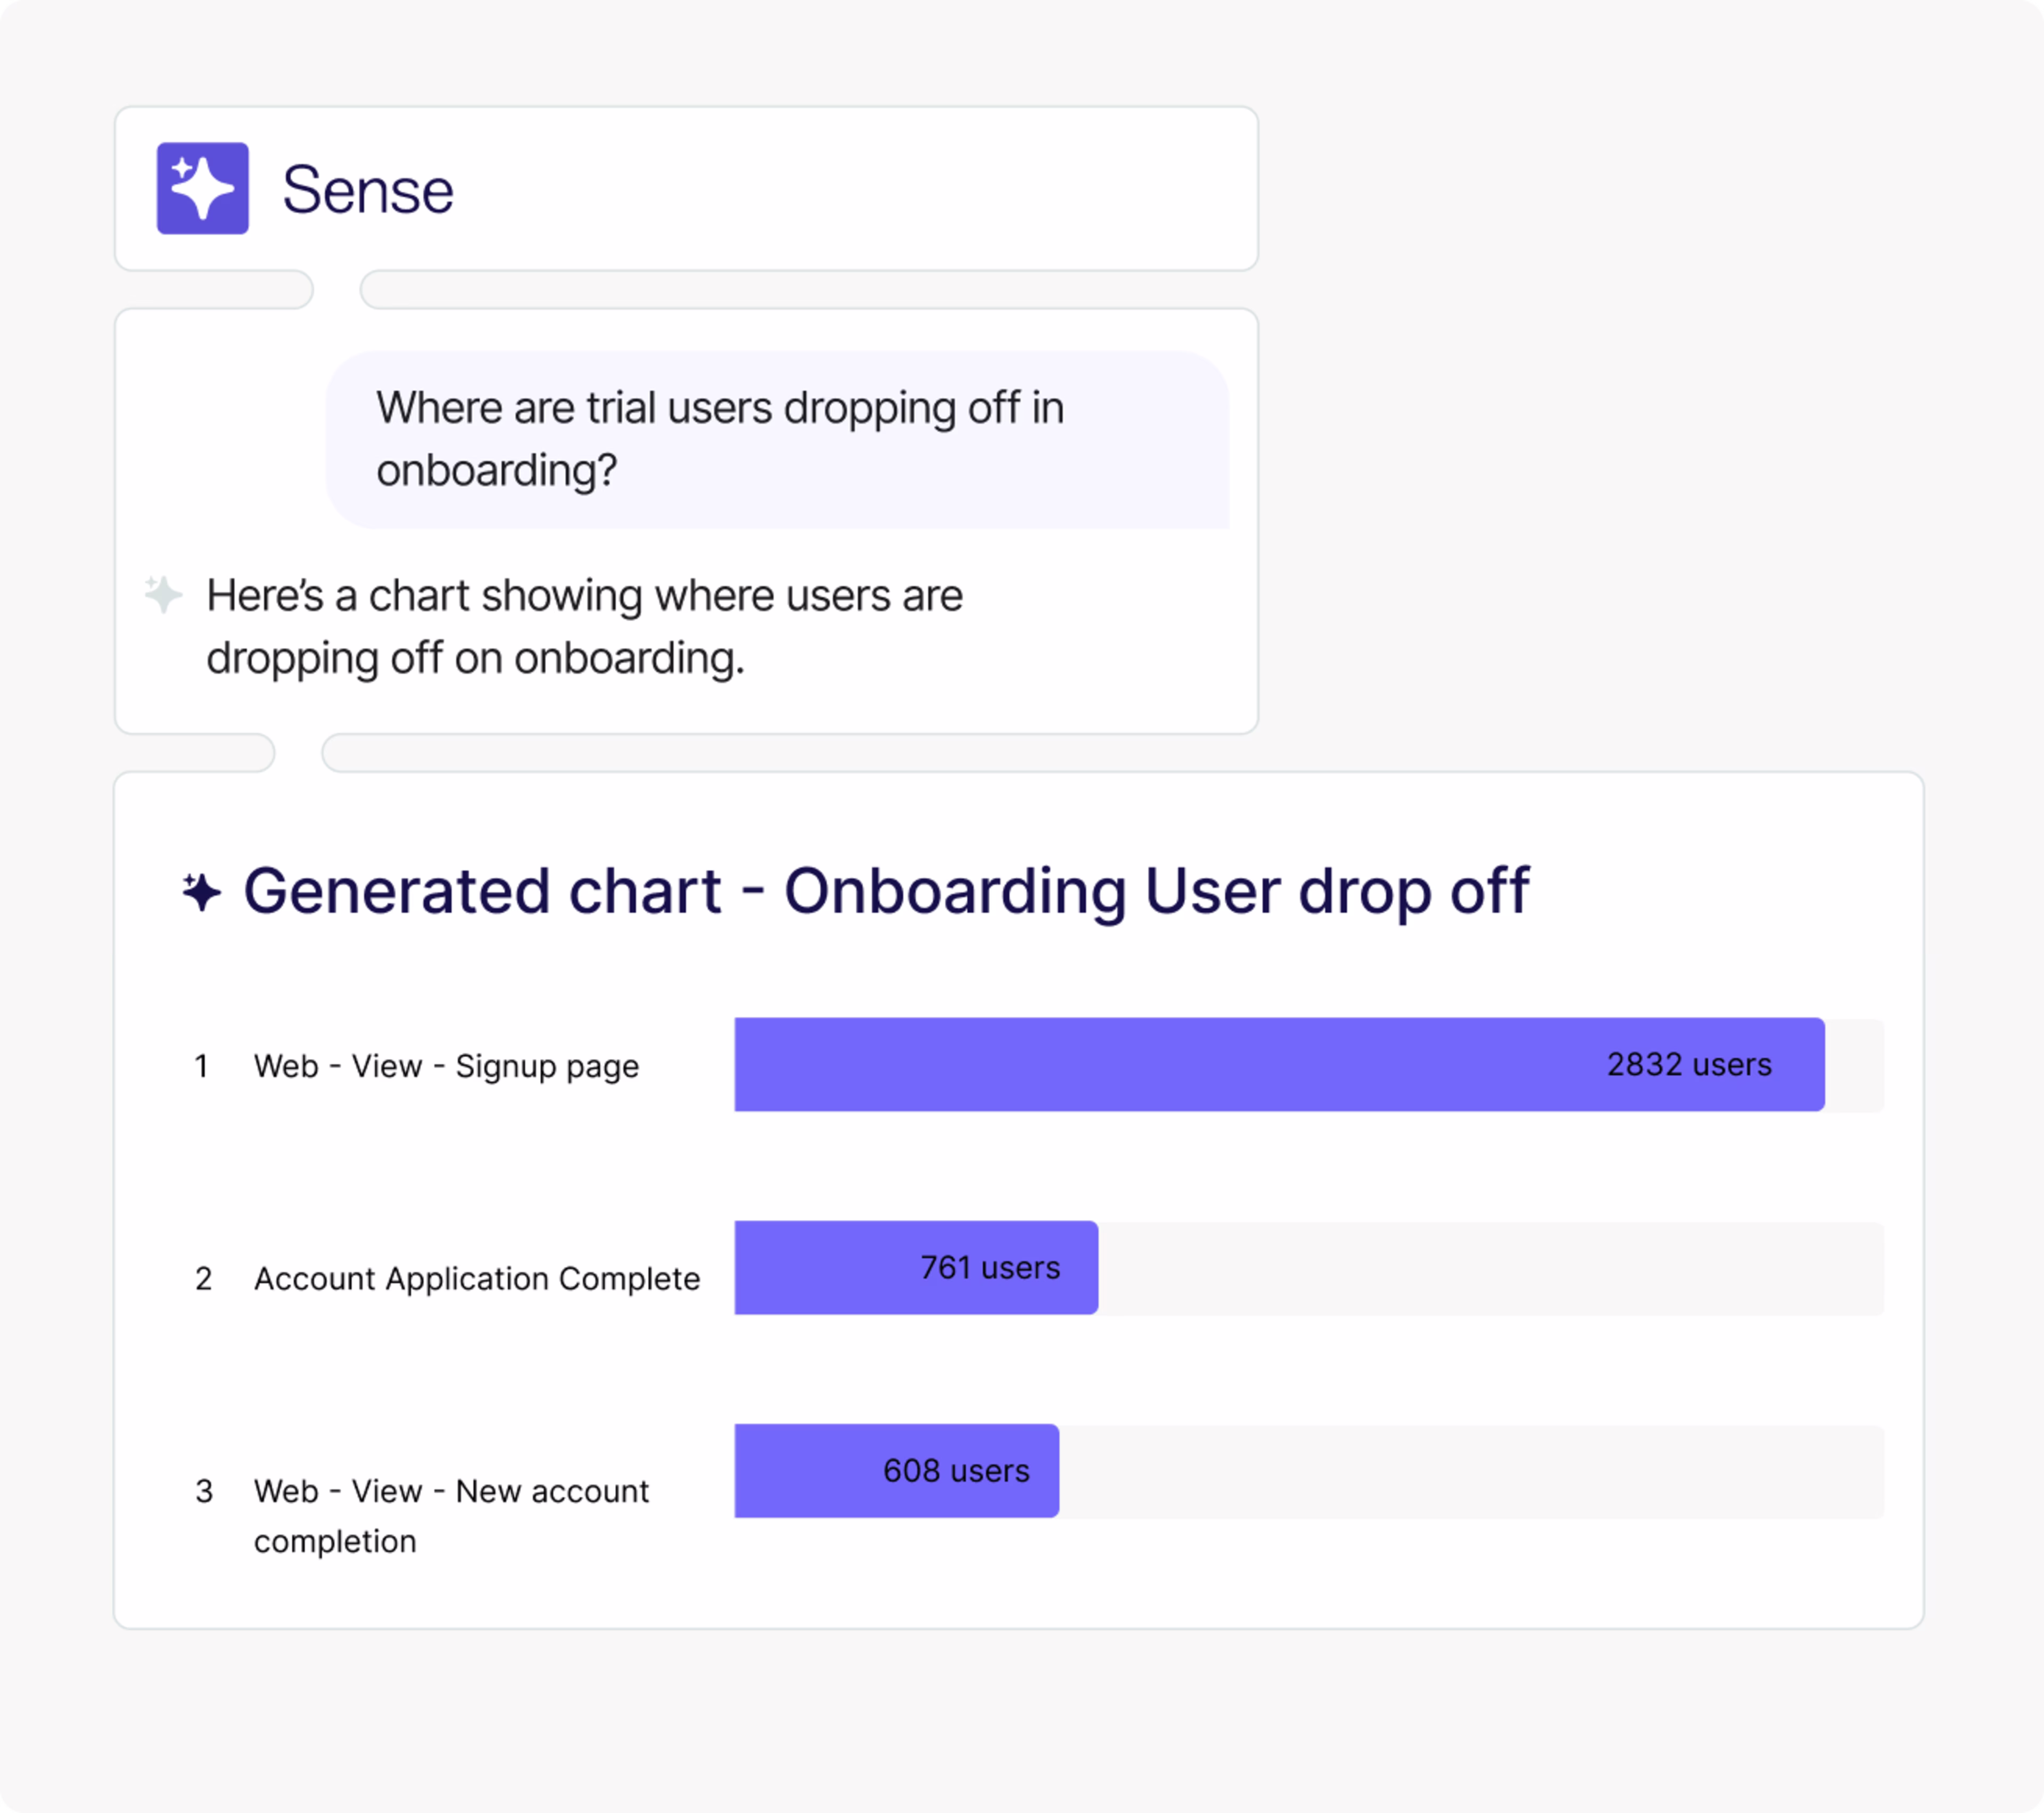
💡 Pro tip: Contentsquare’s AI agent, Sense Analyst, gives everyone their own personal assistant to run complex, multi-step analyses—no data training or expertise needed.
Empower users to ask questions and trigger workflows using natural language—like, “Why are users bouncing from the checkout page?” or “Create an A/B test to optimize this low-performing conversion funnel”—removing barriers to usage and democratizing your data.
5. Measure, monitor, and iterate
Look back at your goals from Step 1 to understand how well your strategy is performing. Your definition of ‘success’ will vary depending on the objectives you set, but some metrics to monitor include
Improvements in data quality (like fewer errors or duplications and increased data consistency and completeness)
Reduction in data-related security incidents
Company-wide usage and adoption of data tools
Analyst time saved due to automation and self-serve tools
Similarly, how well were stakeholders able to access, understand, and leverage the data they needed? Consider running internal surveys to capture user feedback and understand how your data can better support different teams going forward.
As you assess performance, look for ways to improve your strategy and optimize efficiency. Ask yourself:
What other data sources can you include?
How can you leverage new and emerging capabilities, like using machine learning (ML) and automation to proactively prevent churn?
With a solid data foundation in place, it’s easier to adopt and innovate faster—and more safely.
How Schneider Electric revolutionized the way they understand, measure, and report on the digital customer experience
Schneider Electric is a global leader in energy technology. When they wanted to improve CX on their website and streamline the user journey, they turned to Contentsquare to identify the root causes of user friction—and how to fix them.
They used Data Connect to automatically and retroactively bring behavioral data into their warehouse. This enabled the team to combine qualitative and quantitative data when measuring the customer experience, providing a more holistic understanding of where and why customers were getting frustrated.
With these insights, they made targeted improvements to their site that reduced support calls and increased customer experience and Net Sentiment Score (NSS) metrics.
Data Connect drives efficiency by requiring less custom development. Most importantly, it provides us with access to frustration data. By having a full view of what’s happening on our website, we can enrich our customer feedback data and better understand our customers.
Turn your data into your strategic advantage
A data management strategy is your roadmap to turning raw data into actionable insights, reducing risk, and deeply understanding your customers.
The right strategy puts secure, trustworthy, and connected data at everyone’s fingertips—as well as AI-powered copilots and analysis to unlock maximum value and guide informed decision-making—transforming your data architecture into your competitive advantage.
FAQs about data management strategy
A data management strategy is a plan for how your organization collects, organizes, stores, protects, and uses data. Some key components of a data management strategy include data integrity and quality, data governance, and data democratization.
![[Visual] Contentsquare's Content Team](http://images.ctfassets.net/gwbpo1m641r7/3IVEUbRzFIoC9mf5EJ2qHY/f25ccd2131dfd63f5c63b5b92cc4ba20/Copy_of_Copy_of_BLOG-icp-8117438.jpeg?w=1920&q=100&fit=fill&fm=avif)