![[Visual] Churn prevention - stock image](http://images.ctfassets.net/gwbpo1m641r7/1pt2xn0ppryr3YCMcnF22C/58b89c56360789c3df903a756975a35c/AdobeStock_520992702.png?w=3840&q=100&fit=fill&fm=avif)
Your customer churn prediction model is only as good as the data behind it. Right now, key user signals—like frustration, hesitation, or journey drop-offs—are missing from the picture. That leaves teams reacting after a user churns instead of spotting the signs early enough to intervene.
But what if your model could pick up on these subtle behavioral clues before the user was out the door? Now it can.
In this guide, we show you how to enrich churn prediction with frustration scoring, journey analytics, and behavioral patterns, fed directly into your data warehouse through Contentsquare’s Data Connect. By the end, you’ll know how to turn hard-to-catch moments into early warnings and give your team the time and tools to act before users walk away.
Key insights
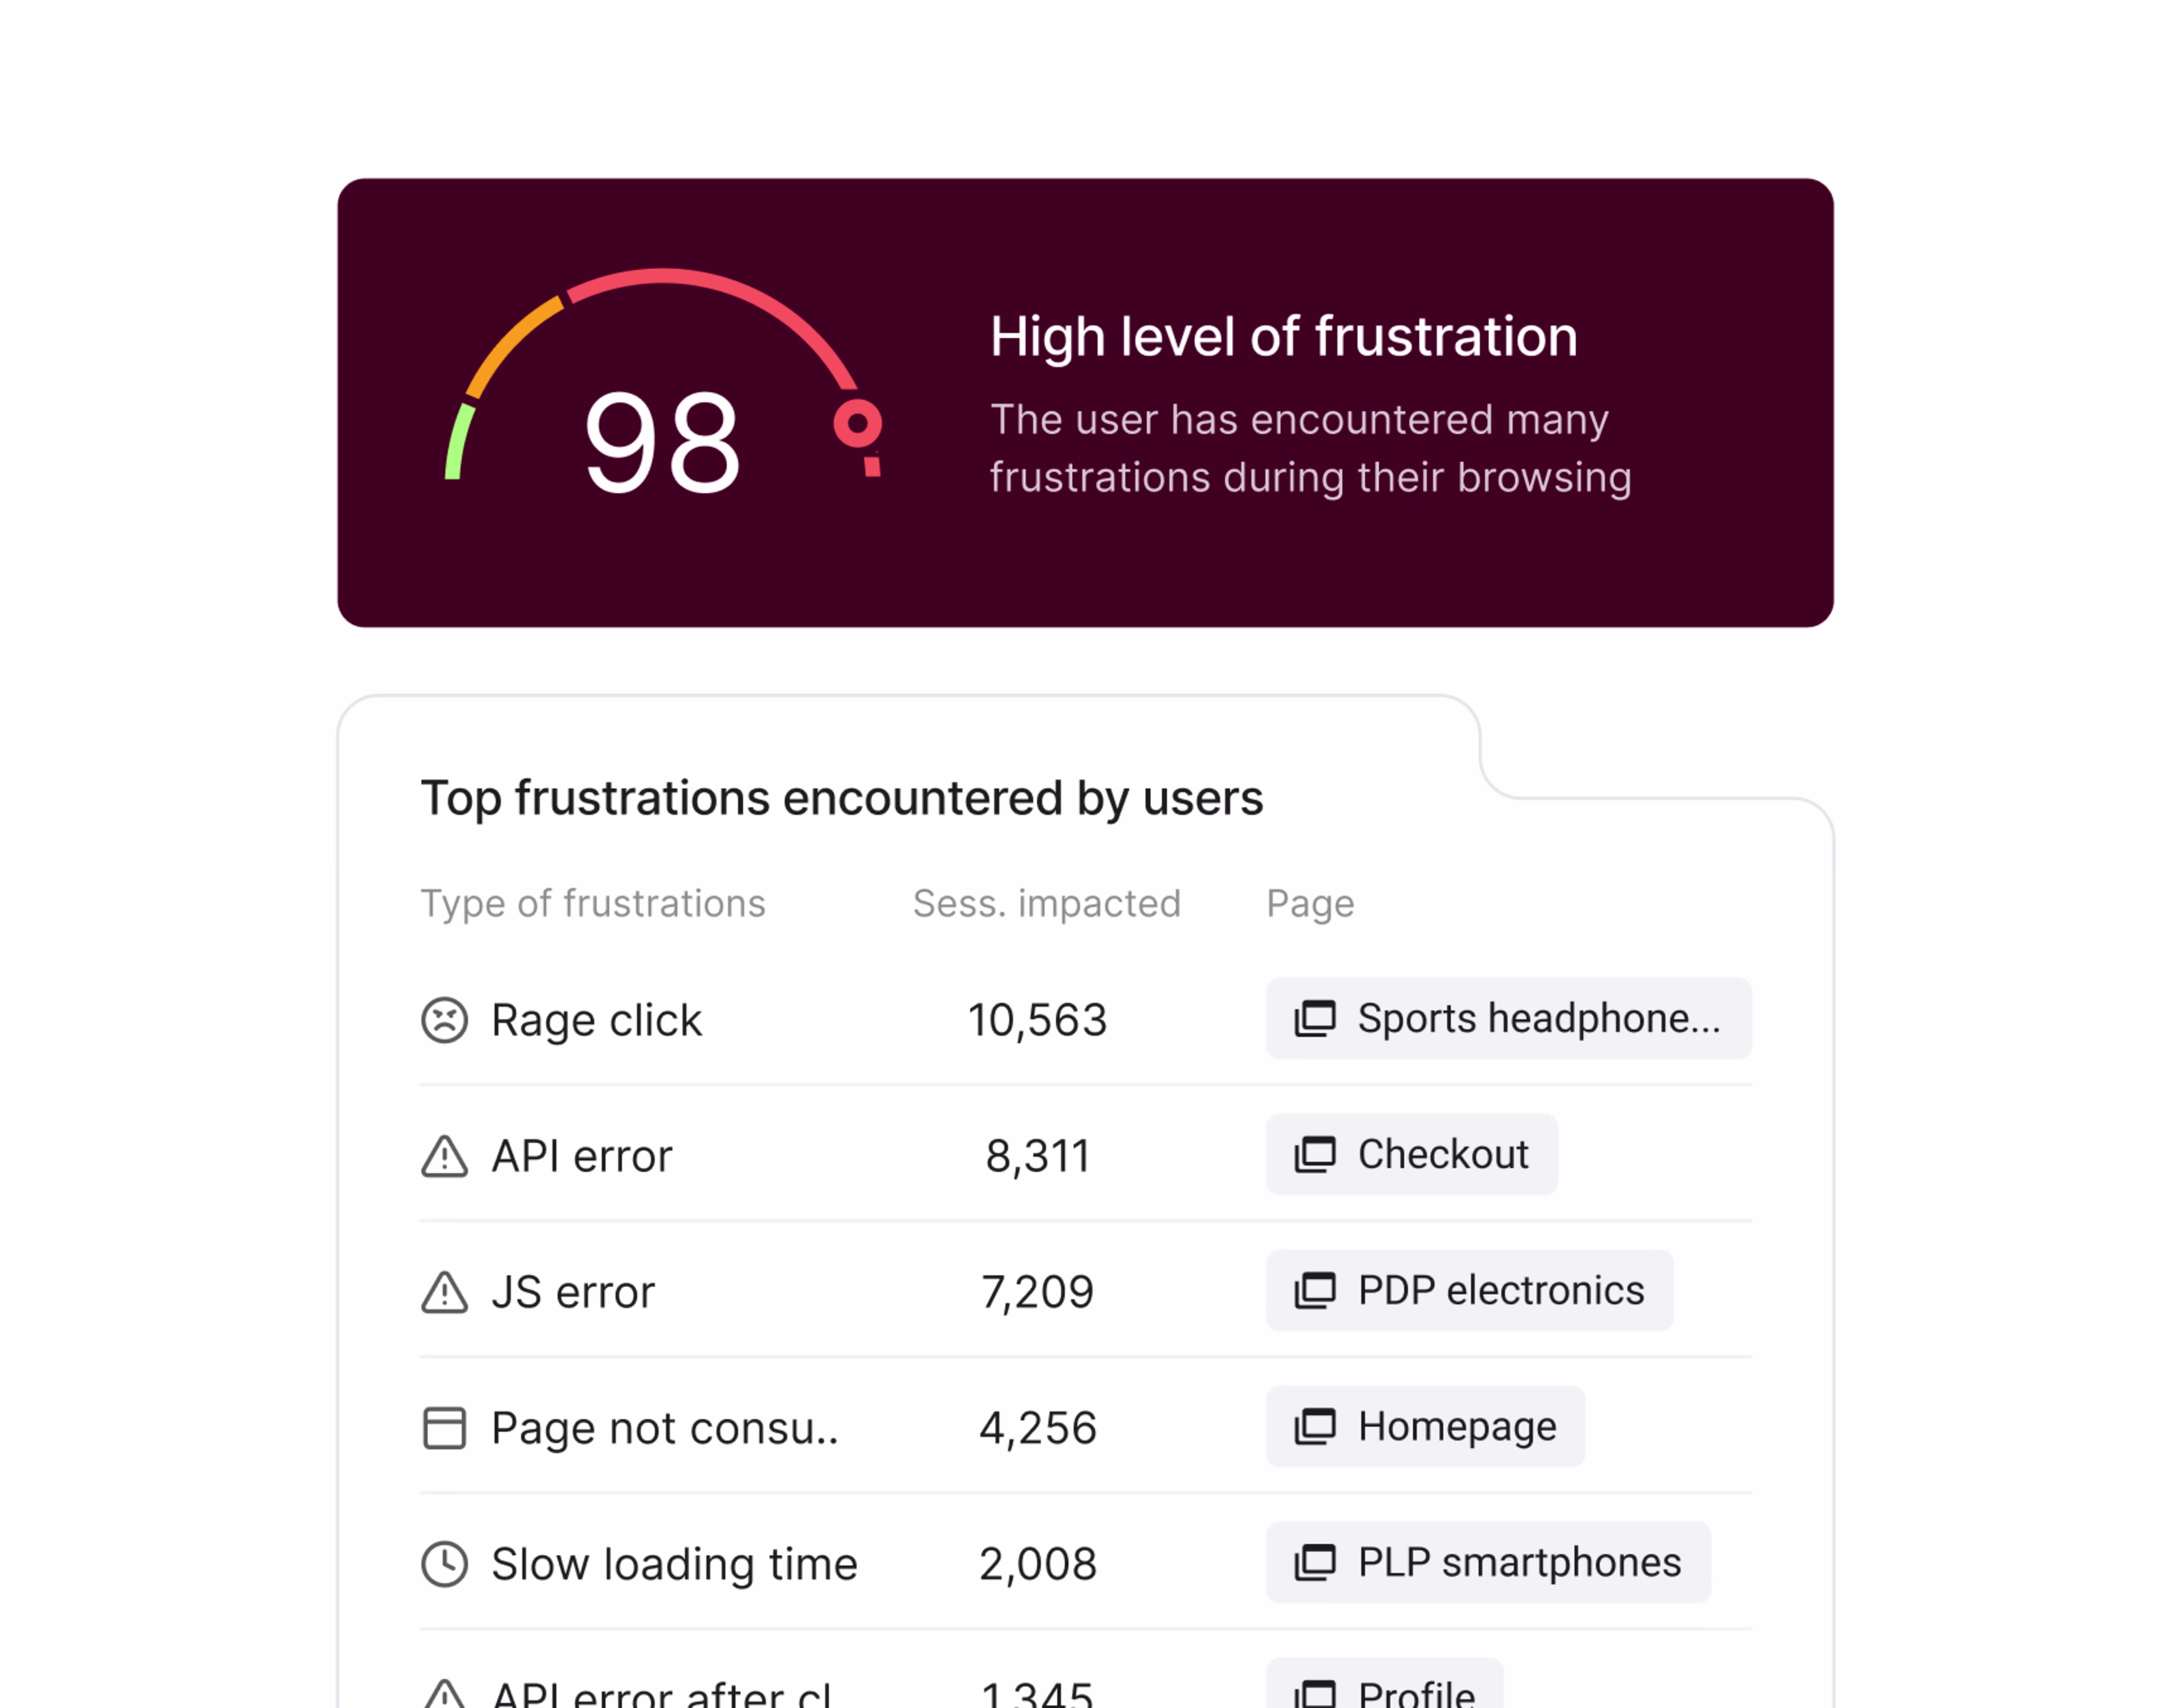
The hidden moments are where churn begins. Users don’t just leave—they hesitate, rage-click, and disengage first. Capturing those invisible moments helps you turn churn prevention into a proactive, continuous practice.
Behavior tells the truth before metrics can. Traditional churn signals are lagging indicators—by the time you see them, it’s often too late. Behavioral data uncovers frustration and confusion in real time, so you can act early.
Connected data bridges intent and action. It transforms hard-to-capture emotional signals into structured data your existing churn model can understand—no dev time, no guesswork, just smarter decisions faster.
What is churn prediction?
Churn prediction is the process of identifying users who are likely to stop using your product or service, so you can take action before they leave.
The real value of accurate churn prediction is that it helps you be proactive. Instead of waiting until a user’s already gone, you can jump in with personalized support, fix frustrating issues, or offer incentives to keep them engaged.
This type of customer retention isn’t just cheaper than acquisition. It’s smarter. When you keep users happy and engaged, you grow more sustainably, with less pressure on your pipeline. In fact, companies with a net retention rate over 100% grow at least 1.5 to 3 times faster than their peers.
Why customer churn is still so hard to predict—and what’s missing
Predicting churn isn’t new. Most businesses have churn models built on transactional data like subscription status, user frequency, or support tickets.
These signals are valuable, but they’re reactive. They show you what happened after the fact, not what led to it. They're also disconnected from the user's actual experience. Is that usage drop due to disengagement or a frustrating bug they encountered?
Without that behavioral context, it’s hard to know what really drove a customer’s decision to leave—and even harder to intervene in time.
Behavioral data reveals those crucial moments you didn't see: the error loops, rage clicks, excessive hovering, and moments of doubt.
By feeding these subtle cues into your churn prediction models, you unlock one of the main benefits of data integration: a much deeper understanding of user intent. You catch trouble before it turns into customer attrition and a skyrocketing churn rate.
And when you feed that behavioral layer directly into your data warehouse using Contentsquare’s Data Connect, it becomes a scalable, structured asset, ready to power smarter, faster predictions. It automatically exports behavioral, performance, and error data straight to your warehouse—no developers or complex integrations needed.
What Data Connect is | What it’s not | Why it matters |
|---|---|---|
Data Connect is a solution that syncs behavioral signals like rage clicks and journey drop-offs, and technical issues like errors or bugs, straight into your data warehouse. | Data Connect is not a churn prediction tool. It’s a data enabler—one that gives your teams the inputs they need to improve the model they already use. | - No dev time or manual exports - Always up-to-date, retroactive datasets - Data is governed, structured, and ready for AI/ML workflows - Seamless integration with your existing data sources and tools |
Feed these insights into your AI models and algorithms, power smarter retargeting campaigns, or fuel analytics that let you intervene before customers leave.
6 steps to turn customer behavior into predictive power
This step-by-step guide walks you through using Data Connect to bring powerful behavioral signals into your churn prediction model. We'll show your data team exactly how to capture these insights, connect them to your existing systems, and transform them into actionable intelligence.
Throughout this guide, we'll use a practical example: addresing frustration-driven churn in a SaaS company. We'll identify users showing signs of struggle before they leave, and create targeted interventions to keep them engaged.
1. Define your churn goal
Before diving into behavioral data, you need to clarify exactly what type of churn you're trying to predict. Different churn patterns require different signals and interventions.
Ask yourself:
Are you targeting voluntary cancellations where users actively decide to leave?
Is involuntary churn (like payment failures or technical issues) your primary concern?
Are you watching for dormant users who gradually disengage?
Do you need to predict trial abandonment before conversion?
Be specific about timing, too:
Early-stage churn (first 30 days)
Mid-term churn (30-90 days)
Long-term retention risks
In our SaaS scenario, we're focusing on users who might be frustrated and churn because of poor experiences. This is classic voluntary churn, but with a twist. Rather than waiting for explicit cancellation signals, we want to catch the subtle frustration indicators that precede the decision to leave.
By defining this specific churn goal, we can now target the exact behavioral signals that matter most: friction points, confusion moments, and signs of user struggle.
2. Gather behavioral data
With your objective in mind, you can start to collect the right behavioral signals that indicate frustration to feed into your model.
Unlike traditional metrics that show outcomes (like feature usage or logins), behavioral data reveals the quality of those interactions—the emotional layer of user experience.
Choose behavioral metrics that highlight where users struggle, like hesitation time, journey bounces, or the last touchpoints before they drop off. Prioritize the high-stakes moments in your experience, such as onboarding, core feature use, or billing, where frustration is more likely to lead to churn.
Using data integration and enrichment tools and capabilities, Contentsquare makes it easier to spot those signals:
Frustration Score gives you an out-of-the-box metric that captures signs of struggle, like rage clicks or dead clicks
Journey Analysis pinpoints exactly where users abandon key flows, so you know which step is causing friction
Heatmaps show where attention fades or lingers, revealing confusion or missed opportunities
Session Replay lets you watch real user sessions to understand usability issues in context
Product Analytics helps you measure how users engage with key features and where friction slows them down

When Contentsquare’s capabilities work together, user frustration stands out
For our SaaS example, we may discover that many new customers are getting stuck during onboarding. Using Contentsquare's capabilities, we identify that the account settings page has an unusually high frustration score.
Heatmaps reveal users repeatedly clicking on non-clickable elements, while Journey Analysis shows a significant drop-off rate at this exact step. Session Replay confirms the issue: users couldn't figure out how to save their preferences, leading to visible signs of frustration before they abandoned the process entirely.
3. Feed data into your warehouse
Capturing behavioral data is just the start. The real power comes when you incorporate it into your existing churn prediction workflows—without disrupting your current tools or models.
With Data Connect as part of your data integration strategy, these signals land directly in your warehouse (like BigQuery, Redshift, Snowflake, or Databricks) alongside your existing datasets. No screen recordings or PDFs—just retroactive, privacy-compliant behavioral data that’s structured in a way that your models can immediately understand.
That means:
Frustration becomes a new feature in your churn model
Journey dropout becomes a trigger for predictive alerts
Behavior-based cohorts become test groups for proactive retention campaigns
The data points arrive clean, structured, and ready to blend with the tools you already use, so there's no need to rebuild your data stack:
Customer relationship management (CRM) records
Business intelligence tools
Support ticket history
Campaign engagement data
Voice of Customer (VoC) feedback
Machine learning algorithms
To address our SaaS churn issue, we’d use Data Connect to pipe frustration scores and journey drop-off data from the problematic account settings page directly into our Snowflake warehouse.
Now, those rage clicks and journey abandonment signals from the account settings page flow directly into tables our data science team can use, right next to our user profiles and activity logs.
4. Combine and enrich customer data
Join behavioral data with CRM records, support tickets, campaign interactions, and customer feedback for smarter churn modeling. The more data you feed in, the more accurate your models will be.
What to combine:
Frustration scores + support tickets: do users who show high frustration also reach out for help, or do they silently struggle?
Journey drop-offs + feature adoption: are users abandoning specific workflows before they can experience your product's core value?
Hesitation time + onboarding completion: where are users getting stuck during crucial first impressions?
Error data + account type: are certain customer segments experiencing more technical issues than others?
You don’t need to be a data scientist to uncover these insights—just a curious product manager who wants to understand what’s really going on.
Take our frustration-driven use case: by combining frustration scores with product analytics and CRM data, we start to see the bigger picture. Here’s how to do it in 3 steps:
Joining frustration scores with conversion rates shows us that a number of customers who struggle with that settings page are 3x more likely to disappear before converting
With CRM data in the mix, the pattern becomes clear: users struggling with the account settings page rarely submit support tickets—they just leave. By connecting the dots between high frustration scores and low support engagement, we identify a segment of ’silent sufferers’ who need proactive help.
Better yet, by adding campaign data into the mix, we discover these churners are more likely to have come through a specific acquisition channel that set unrealistic expectations. Now we can predict—and prevent—this entire category of churn before it happens.
5. Run churn prediction models
Once your behavioral insights are structured and connected with your other customer data sources, you can:
Train models on historical churn events, matching past usage patterns with known outcomes
Create behavior-based user segments, identifying which frustration signals correlate most strongly with churn
Establish real-time monitoring, flagging users who exhibit high-risk behavior patterns
Your enriched dataset is ideal for training machine learning models that assess churn risk. Using algorithms like decision trees, random forest, or logistic regression, you can create a model that accurately predicts the likelihood of churn based on a combination of behavioral and transactional data.
Your algorithm uses the training data flowing from Contentsquare via Data connect to learn to look for predictive signals that traditional models miss, like:
Spikes in frustration scoring (e.g., rage clicks, repeated backtracking)
Drop-offs in high-value journeys or conversion flows
Decreased usage of core features
Behavioral changes vs. historical patterns
Contentsquare automatically surfaces the most critical points of friction as they happen
In our SaaS scenario, we’d use our newly combined dataset to build a frustration-based churn prediction model. We’d train it on 6 months of historical data, identifying which behavioral patterns most strongly predicted eventual churn.
The advanced churn analysis might reveal that users who showed frustration signals in their first 3 sessions are 4x more likely to abandon their trial. Even more specifically, when users spend more than 30 seconds on the settings page with multiple rage clicks, their likelihood of converting drops by 70%.
With these insights, we can now score every active user on their churn risk—not just based on what features they use, but on how they feel while using them.
Pro tip: Data Connect delivers frustration scoring regularly to your warehouse, letting your churn prediction models evolve in real time. No waiting for manual refreshes—as user behavior changes, your models adapt with fresh behavioral signals on a daily basis.
6. Take action before it’s too late
Spotting churn risk is important, but the real impact comes from how you respond.
Act quickly with these targeted fixes:
Reach out personally: send personalized messages to users showing early frustration signs before they contact support
Optimize the customer experience: fix friction points causing frustration and redesign key journeys to remove obstacles
Guide the journey: launch timely nudges or tooltips to guide at-risk users past trouble spots
Test and learn: A/B test different interventions based on behavioral cohorts to find what works best for different user segments
For our frustrated SaaS users, we could implement 4 key interventions:
Trigger help resources: when users hit the troublesome account settings page and show early frustration signals, display contextual help options
Success team outreach: for users with the highest frustration scores, have your customer success team proactively reach out with personalized guidance
Simplify the journey: redesign your settings page based on the behavioral data, removing the friction points that were causing the most rage clicks
Track customer satisfaction: measure user sentiment using a Net Promoter® Score (NPS®) survey at key points in the journey to identify dissatisfaction early and address potential issues before they lead to churn
By linking the frustration signals through Data Connect to our customer retention strategies, we create a continuous feedback loop, allowing us to not just predict churn but actively prevent it.
Pro tip: connect your churn prediction model with your CRM or marketing platform to automate interventions and reduce churn in real time.
For example, 3 rage clicks on your pricing page could automatically trigger a personalized discount email, or hesitation on the onboarding flow might instantly queue a support chat invitation.
This real-time automation is the difference between seeing churn coming and actually stopping it.
Churn is predictable if you’re monitoring the right signals
You can’t fix what you don’t see—and most churn models are blind to the emotional signals that lead up to a user leaving. They rely on final actions like a subscription cancellation or a login that never returns.
By then, it's already too late.
The true opportunity lives earlier, in the messy middle, where your customer base shows up, but something isn't right. Rage-clicks, aimless scrolling, repeated backtracking—these aren't quirks, they're signals of friction.
Unlike static product usage data, behavioral signals are dynamic. They capture what users are trying to do, what’s getting in their way, and how they react in real time.
Contentsquare’s Data Connect makes it easy to bring that picture into your data warehouse and modeling stack, without rebuilding your entire system. So instead of asking “Why did they leave?”, you’ll be answering a much more important question:
“How can we help them stay?”
FAQs about churn prevention
Prediction tells you who might leave. Prevention is about what you do next.
Without good prediction, prevention efforts scatter resources. Without effective prevention, even perfectly accurate predictions are worthless. You need both working together in a continuous feedback loop—which is exactly what Data Connect enables by bringing behavioral signals directly into your action systems.
![[Visual] Contentsquare's Content Team](http://images.ctfassets.net/gwbpo1m641r7/3IVEUbRzFIoC9mf5EJ2qHY/f25ccd2131dfd63f5c63b5b92cc4ba20/Copy_of_Copy_of_BLOG-icp-8117438.jpeg?w=1920&q=100&fit=fill&fm=avif)