In an ideal world, digital businesses test everything they ship, enabling teams to make informed decisions that drive fortunes. In real life, companies strive to meet this standard by cultivating a culture of experimentation—and that means A/B testing specific ideas on a control group and measuring their impact.
This ensures two helpful things happen: good ideas mature and develop fully, and bad ones go back to the drawing board.
This guide shows you how to conduct effective A/B testing to consistently ship website changes your users love.
It gets better! Our detailed walkthrough also explains how to know which version is winning users' hearts and uncover why that’s the case. Spoiler alert: the key to unlocking the why lies in using complementary platforms like Contentsquare (yes, that's us!).
Excited to see how? Let's begin.
How to do A/B testing the right way: 5 steps for success
A/B testing, sometimes called split testing, is your best bet in setting the direction for your teams—whether that's devs, user experience (UX), product, marketing, or design. While relatively simple to set up, impactful A/B testing involves more than you think.
Combining test results with replays, heatmaps, and user feedback tools allows you to evaluate performance, spark new ideas, and encourage user-led innovation like never before. It also reduces the time needed to run tests that yield valid, actionable results—but more on that later.
First, let’s look at how to run A/B testing the right way in 5 easy steps.
Step 1: formulate an evidence-based hypothesis
It all starts with an idea. For example
A streaming platform wants to update its personalization system to help users find more content, with the goal of boosting customer satisfaction and retention
An ecommerce store wants to streamline the sign-up flow for new users, leading to a potential sales uplift
But an A/B test must run on more than assumptions. It requires some informal research—digging into available data to generate ideas worth testing. Commonly, teams formulate a hypothesis based on blended quantitative and qualitative insights—like top exit page lists combined with exit-intent survey responses.
🧪 What makes a good hypothesis?
A good hypothesis is an educated and testable statement that:
Proposes a solution or explanation to a problem
Predicts an outcome for the experiment
Provides reasoning for the expected result
Here's a sample hypothesis we grabbed from Netflix: “If we make change X, it will improve the member experience in a way that makes metric Y improve.”
When the user experience (UX) wizards at Netflix were planning to test the 'Top 10' lists we see on the web user interface (UI), the hypothesis went: “Showing members the Top 10 experience will help them find something to watch, increasing member joy and satisfaction.”

Netflix’s Top 10 experience
Step 2: select your A/B testing tool
Next, find a suitable A/B testing tool to run your experiment. Here’s a quick rundown of some of the top options:
3 most popular A/B testing and product experimentation tools
1. Optimizely
A leading experimentation platform, Optimizely enables even non-developers to run A/B and multivariate tests on their websites. Its user-friendly interface and intuitive UX cater to a broad range of users, including designers and marketers.
👍 Pros:
Facilitates effective reporting
Triggers surveys in test variations
Enhances conversion rate optimization (CRO) efforts
Part of the Contentsquare partner ecosystem
👎 Cons:
One of the pricier options
2. AB Tasty
AB Tasty is an all-in-one CRO platform offering A/B testing, personalization, user engagement, and audience segmentation. Easily mix and match targeting options, like geolocation and user behavior, to create tailored experiments for your ideal audience.
👍 Pros:
Unlimited experimentation
Easy to use for teams with limited technical skills
Part of the Contentsquare partner ecosystem
👎 Cons:
Fewer advanced experimentation capabilities
Slower page load speeds
3. Contentsquare
Contentsquare (hi again!) is an all-in-one experience intelligence platform that teams can use to monitor their site’s digital experience. Integrating Contentsquare with an A/B testing tool supplements your tests and helps you identify real opportunities for improvement.
Instead of listing Contentsquare’s pros and cons, we’ll give the floor to our actual users: 👉 read their reviews here.
Note: steps 2 and 3 are interchangeable. You can decide on the nitty-gritty of your test before settling on a tool with all the features you need to run your experiment effectively.
Step 3: set up your experiment
Remember, your hypothesis clarifies what you're trying to change and the primary metric you're measuring. When you finalize your hypothesis, proceed to
Create two versions of…something. Anything!—an email subject line, a call-to-action (CTA) button, or a landing page layout. The baseline or 'control' version A displays the incumbent element, design, or page. At the same time, ‘variation’ B deploys with the change or group of changes you want to study. Both versions should be identical in all other ways.
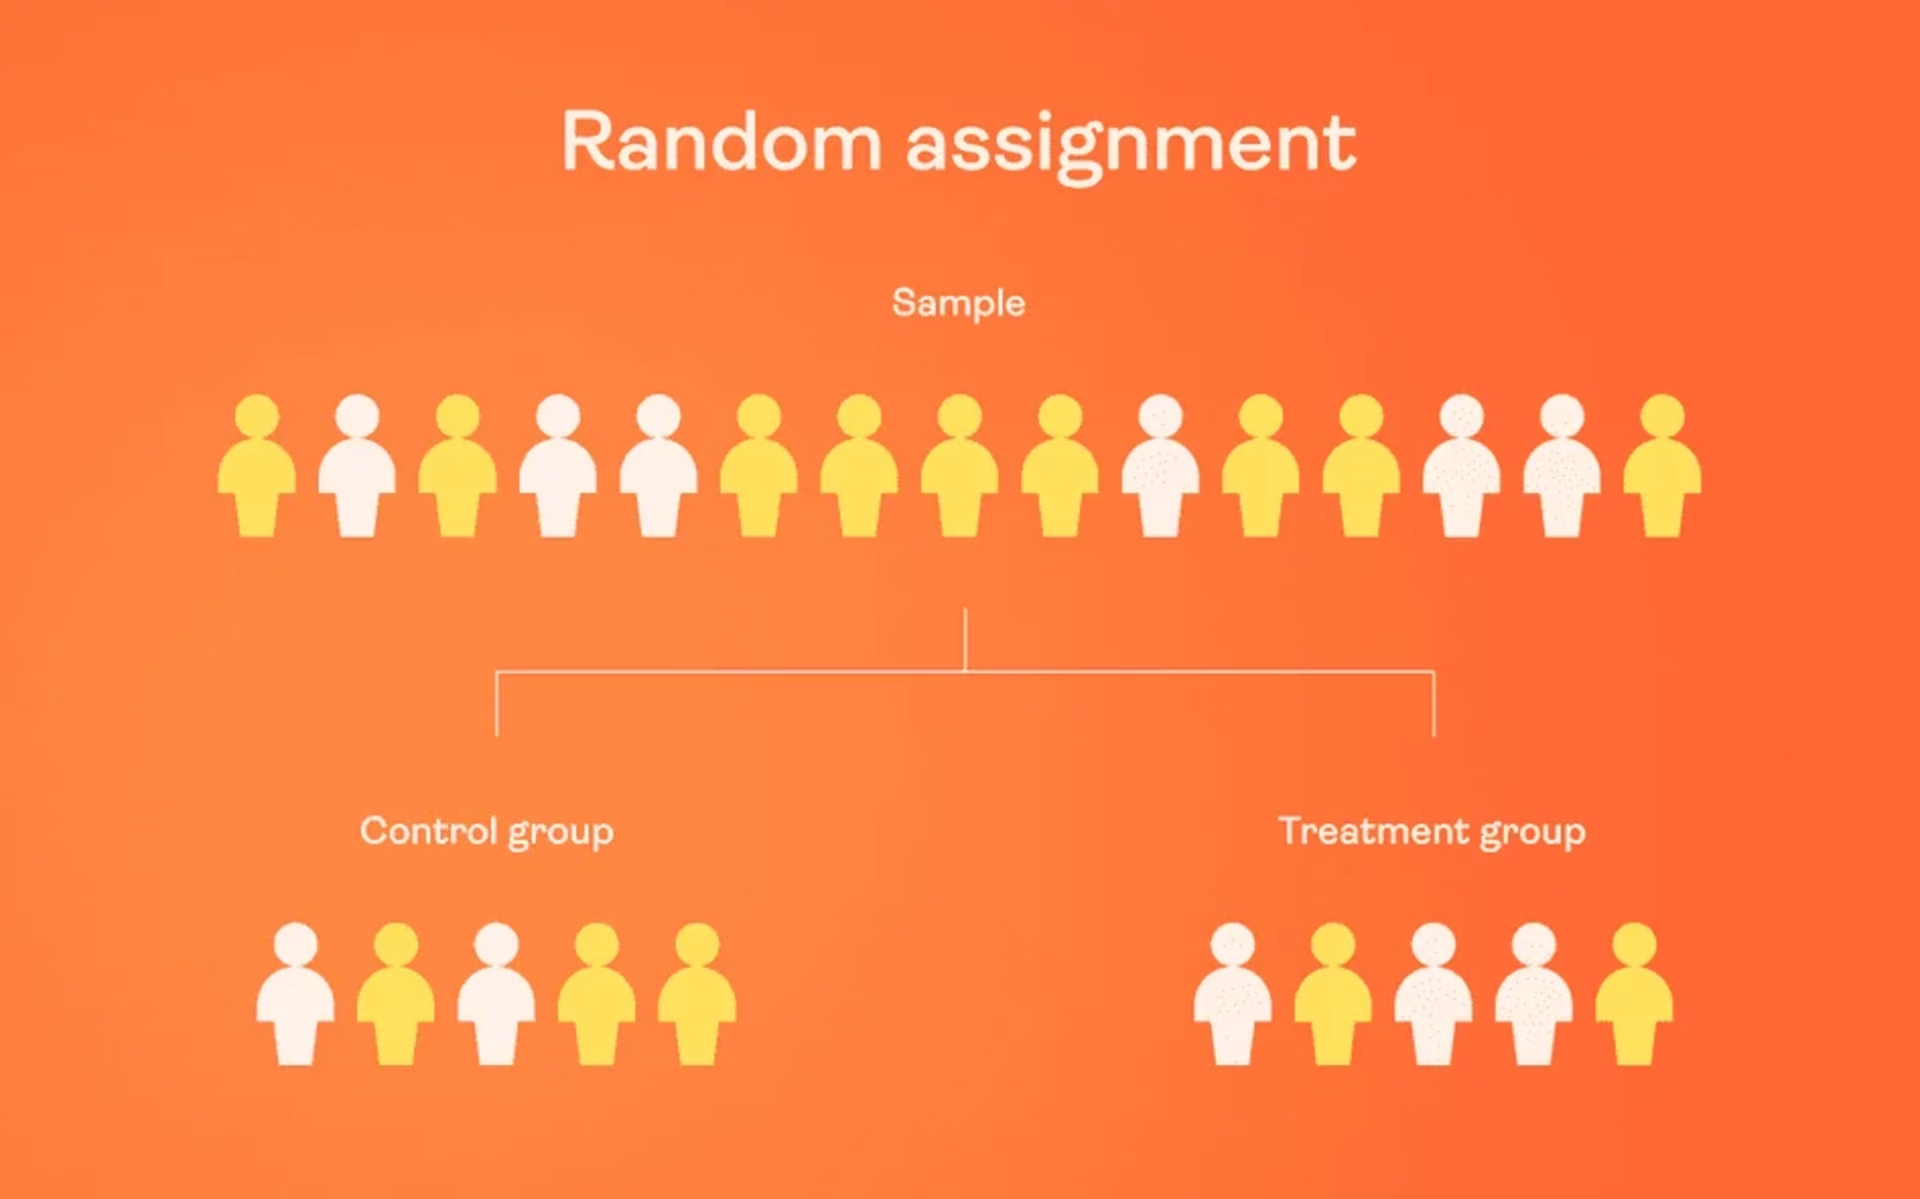
Take a subset of your users or members to act as your sample. Then, split your sample evenly into two groups using random assignment. One group sees the control version, and the other encounters the variation.

How random assignment works in A/B testing your product or website
Decide what your confidence level should be. Confidence level determines how sure you can be of your results. In market research, it's common to use a 95% confidence level. This means if you ran the experiment 20 times, you'd get the same results (with a margin of error) about 19 times.
Determine the sample size and timeframe for your split tests. Depending on your A/B testing tool, you can set the sample size and test duration. If you need help deciding what to choose and there's no analyst to ask, try this sample size calculator.
Set up and run your experiment on your chosen A/B testing tool. A/B test landing pages, CTAs, headers, and other variables one at a time for the same marketing campaign to ensure the causal chain will be linked back to a specific change or set of changes instead of a jumble of factors.
Step 4: analyze your A/B test results
When analyzing test results in your A/B testing tool, paying attention to statistical significance is important. You don’t want to push forward with a version that only appears superior because of a sampling error or random chance. Generally, a statistical significance of 95% indicates you have a clear winner to give the go-ahead.
Celebrate if you've got a statistically significant outcome, disable the losing variation in your A/B testing tool, and move forward with the winning version! 🎉
But what if neither variation is statistically better? In that case, you'll have to mark the test as inconclusive, indicating that the variable you tested didn't significantly impact the results.
Don't worry, you can still learn from the experience: stick with the original version or use the failed data to help you create a fresh iteration for a new test.
For instance, imagine your ecommerce marketing team just finished A/B testing 2 different product page layouts. You've collected data on click-through rates, add-to-cart rates, and sales, but the results show no clear winner.
Now what?
You could take a closer look at the data to see if there are any user subgroups that respond differently to the variations. Or, you could try a new test with a different variable, such as one involving alternative product descriptions or pricing strategies.
💡Pro-tip: running A/B tests can reveal what users like or dislike about your website, products, or services. But they lack the context—the answer to why customers prefer one variation over another.
As an experience intelligence platform, Contentsquare helps you confidently fill in the gaps and better understand user behavior and preferences. Through our integrations and technology partnerships, you can watch replays and analyze heatmaps or trigger surveys for your Optimizely and AB Tasty experiments.
Now, you’ll be able to gather qualitative insights into, say, your homepage redesign from a subset of your users before you spend all the time, money, and effort rolling it out to the masses.
Step 5: watch session replays of your experiments
With the help of complementary A/B testing tools offering deeper behavior analytics insights, look at session replays to see exactly how users interact with your experiment variant—where they move, what they click, and what they ignore.
This way, you won’t just know which version is the winner—you’ll also know exactly why.
Here are some ways to analyze your replays and add qualitative insights to your product experimentation method.
Keep an eye out for engagement and expected behavior, but also note any unexpected signs of friction, like rage clicks
Follow the visitor's path throughout the replay to see where the tested element fits into the user journey and if it's making the experience easier or changing the trajectory
💡Pro-tip: use Contentsquare’s Frustration Scoring to prioritize fixes.
Frustration Scoring automatically ranks sessions where users encountered issues. This way, you can easily find replays with areas of friction—no need to sift through hours of content.

Contentsquare automatically surfaces the biggest areas of struggle that make customers turn their back on your site
A/B testing best practices with Contentsquare
As we mentioned, you can also set up Contentsquare outside of the integrations to help monitor A/B tests and add depth to your A/B testing with the quantitative and qualitative data these tools provide. You'll know what to do (or not do) next, ensuring no resources are wasted on ineffective changes.
Show a feedback widget on a variant
Get user feedback on a specific page variant. Contentsquare’s Feedback Collection widget makes it easy for users to express their feelings in the moment as they run into a blocker or discover something they like during one of your experiments.
This is where you can run advanced research by using a choice of customer tools, like surveys which allow you to collect feedback from your users—the ones facing the problems, who are also the key to its solution.
Contentsquare’s Feedback widget lets users highlight parts of the page they like or dislike
Compare heatmaps for your control and variant
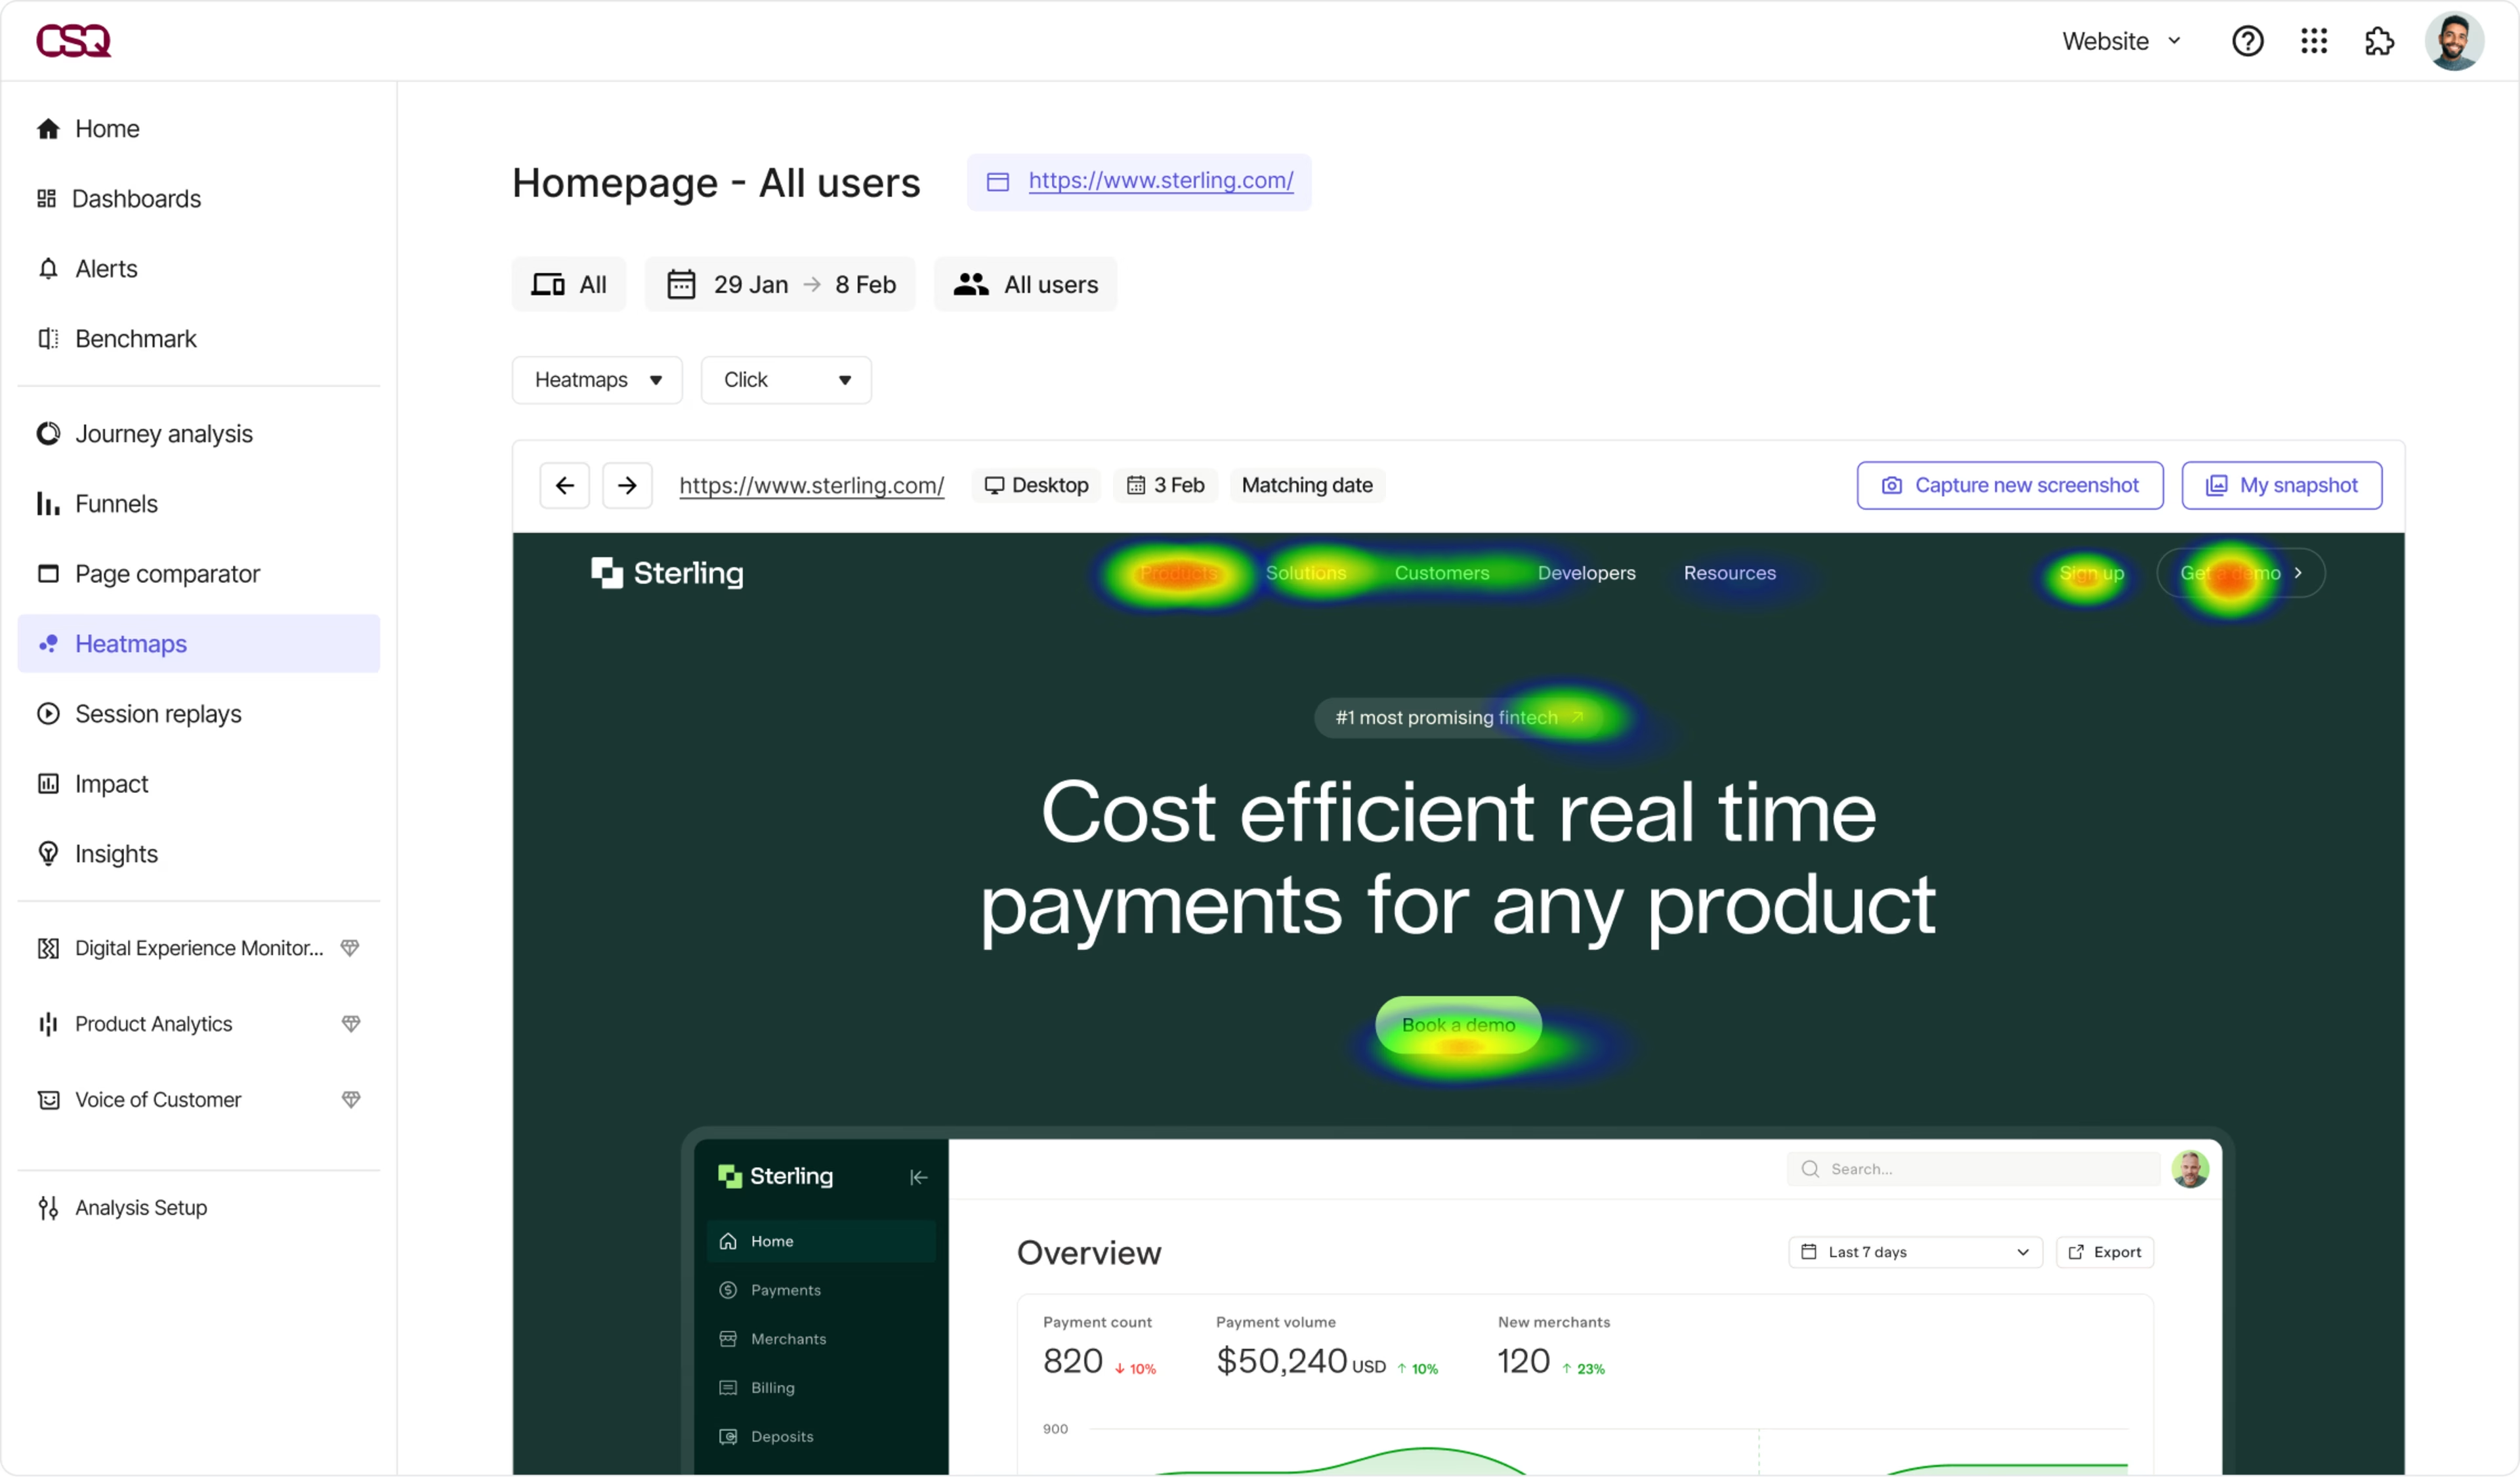
Track your A/B test using heatmaps, depending on the following conditions:
When your variations are on the same URL: this means your A/B test is set up to randomly load any of your two variations for each user visiting the same page. Apply session filters to view their corresponding heatmap.
When your variations are on different URLs: use the heatmap URL filter to track data for each variation. Select a heatmap URL filter and enter your control URL and/or variant URL, then view the corresponding heatmap.

Heatmaps give you more relevant insights during your A/B tests
Watch replays of users exposed to the variant
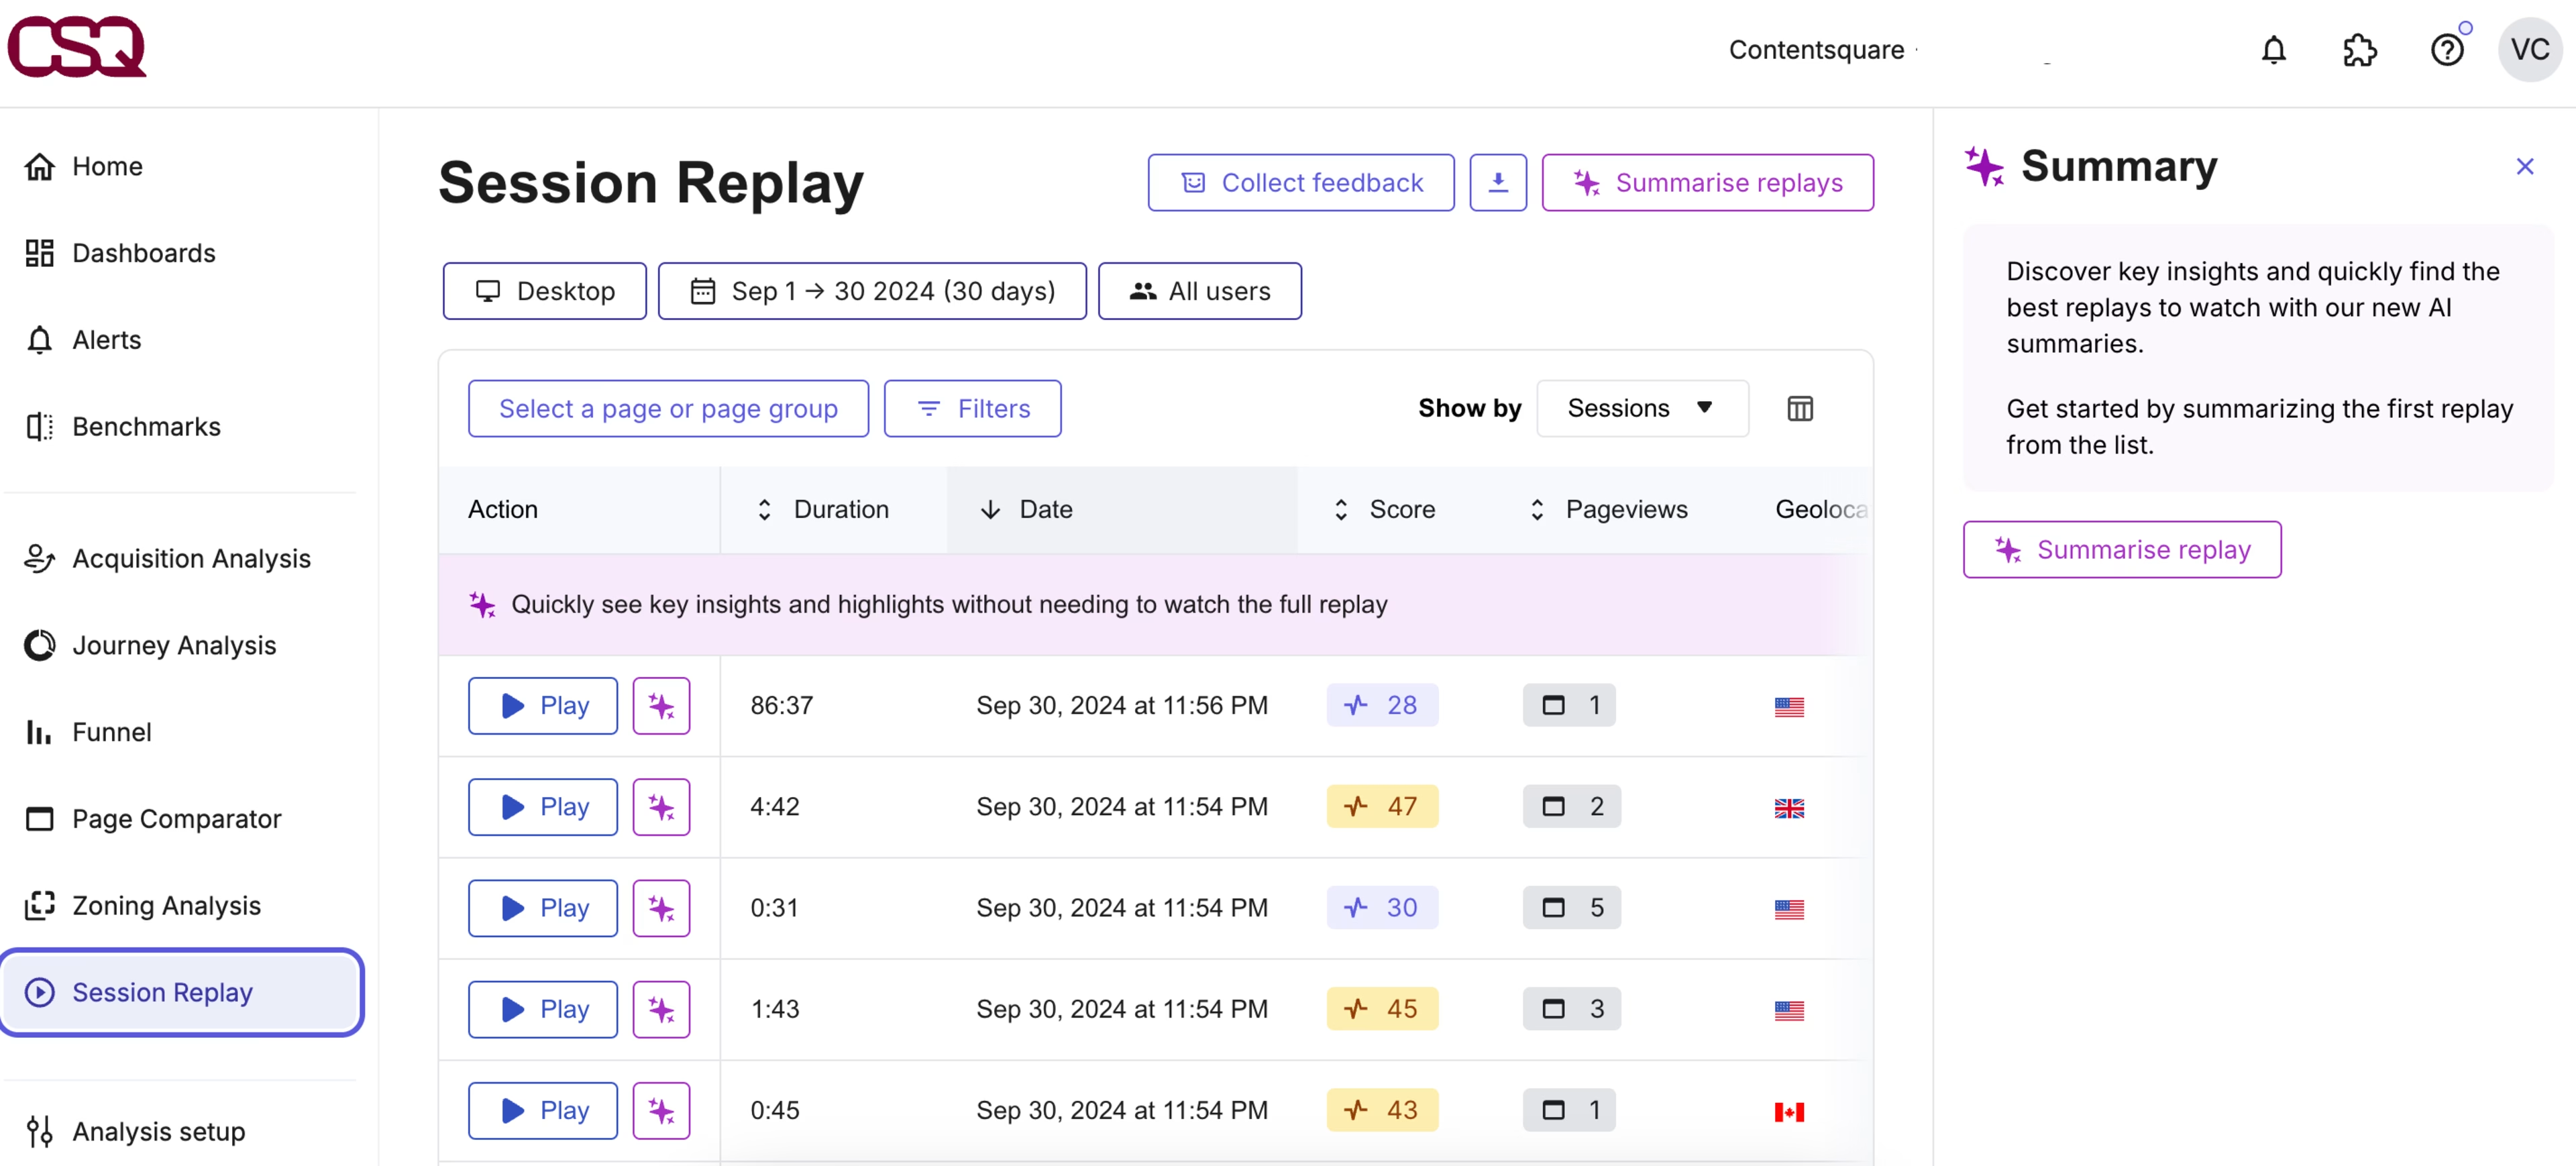
Replays show you how users behave on your site or page variations firsthand. Contentsquare’s Session Replay lets you visualize user behavior during experiments. That way, you can tell if users noticed and responded to changes, and whether there were any usability issues with their experience.
Conveniently, Contentsquare also lets you connect website feedback and survey responses with associated replays for an extra layer of depth into your user insights. When you get a feedback response, jump to the relevant recording to see which actions the user took right before.
By watching these sessions, you can identify which design led to smoother interactions and higher engagement, giving you clear evidence of which layout is most effective.
Find out when your messaging is hitting the mark or leaving users confused
💡Pro-tip: Find opportunities with Contentsquare. Test them with Optimizely.
Through the Contentsquare and Optimizely partnership, you can create smarter experiments, easier and faster. Then, uncover the ‘why’ behind each test’s results and use those insights to power your optimizations—then test them all over again.
Optimizely’s zero-latency, decreased load times, and faster personalized experiences make sure your site, product, or app stays smooth during experiments, thanks to combined caching and support services.
Contentsquare’s Customer Journey Analysis and Zoning Analysis reveal how users navigate your site—what pages they visit, how long they pause, how much they scroll, and where they drop off.
This helps you identify key areas for optimization, so you can run impactful experiments that drive real results.
The advantage of Contentsquare’s A/B test technology is that editing a running test and pushing it to production is easy and immediate.
Deliver conversion-driven changes consistently
Now there's nothing left to do but to take those steps. Start A/B testing even the tiniest tweak before shipping it to your entire user base. And combine multiple sources of data, like heatmaps, session replays, and user surveys, to uncover even more opportunities that aren’t obvious when looking at test results alone.
Ensure you're not making changes that could hurt your conversion rates or user engagement—and waste precious company resources—when you enhance your experiments with Contentsquare.
A/B testing FAQs
A/B testing is an experimentation methodology that compares two versions of an app or web page to determine which one performs better. Different groups of users are shown version A or version B at random, and their interactions are measured and compared to see which one leads to your desired results.

![[Visual] Contentsquare's Content Team](http://images.ctfassets.net/gwbpo1m641r7/3IVEUbRzFIoC9mf5EJ2qHY/f25ccd2131dfd63f5c63b5b92cc4ba20/Copy_of_Copy_of_BLOG-icp-8117438.jpeg?w=1920&q=100&fit=fill&fm=avif)