4.7
en G2
4.7
en Gartner

Why choose Contentsquare over Glassbox?

Choose Contentsquare for a comprehensive end-to-end analytics solution, with retroactive Autocapture and AI-driven insights from Zoning and Journey Analytics—so teams can proactively optimize, not just troubleshoot session replay.

Compare Contentsquare with:

CSQ Wordmark Black

See how issues and updates affect your KPIs

1-click Impact Quantification reveals how any issue affects your key results, like revenue and conversion. Use it to prioritize updates intelligently and predict ROI on potential changes.

Ideal for full-funnel optimization

Understand technical issues and behavior across the whole user journey. Find where users are struggling, hear directly from customers, and compare journeys to see what drives results.

Understand how page elements affect results

Know whether visitors clicked a page element, ignored it, or didn’t see it at all. Impact Quantification shows you how any page element impacts conversions and revenue. Clear answers, zero stress.

Glassbox Logo

Find issues but wonder about their impact

Glassbox shows you IT problems affecting your website or app. But when it comes to assessing their impact on your business, you’re limited to basic “What is it costing us?” insights at best.

Limited insights beyond technical issues

Glassbox helps you spot struggles and technical issues—but it’s not ideal for broad, cross-team optimization. And with no VoC tools, it can’t show you what users are saying either.

Stop at basic insights for page elements

Answering questions like “Did people miss this, or did they see it and ignore it?” or “Which form field is causing drop-off?” isn’t easy. You can do it with custom data-slicing, but Glassbox won’t give you these insights out of the box.

Más de 1,3 millones de sitios web y aplicaciones y 3000 marcas ya utilizan Contentsquare

Comparison table

Feature

CSQ Wordmark Black

Amplitude Logo

Fullstory logo

Pendo Logo

Mixpanel logo

Glassbox Logo

Quantum Metric Logo | Compare Hub

Session replay

Checkmark

Checkmark

Checkmark

⚠️

(varies)

Checkmark

Checkmark

Checkmark

RUM & Synthetic Monitoring

Checkmark

⚠️

(limited)

⚠️

(limited)

Cross

Cross

Cross

⚠️

(limited)

Heatmaps

Checkmark

Checkmark

Checkmark

⚠️

(varies)

Checkmark

⚠️

(varies)

⚠️

(varies)

Journey analysis

Checkmark

Checkmark

⚠️

(limited)

⚠️

(limited)

⚠️

(limited)

⚠️

(varies)

Checkmark

Funnels

Checkmark

Checkmark

Checkmark
(basic)

Checkmark

Checkmark

Checkmark

Checkmark

Segments / cohorts

Checkmark

Checkmark

Checkmark

Checkmark

Checkmark

Checkmark

Checkmark

Retroactive analysis (no strict pre-tagging)

Checkmark

Checkmark

Checkmark

⚠️

⚠️

Checkmark

Checkmark

Product analytics (event-based)

Checkmark

Checkmark

⚠️

Checkmark

Checkmark

⚠️

⚠️

Digital experience analytics (DXA) focus

Checkmark

⚠️

Checkmark

⚠️

⚠️

Checkmark

Checkmark

Voice of Customer (surveys/feedback)

Checkmark

Checkmark

⚠️

(partners)

Checkmark

Cross

Checkmark

Cross

Friction signals (rage, dead clicks)

Checkmark

Checkmark

Checkmark

⚠️

Cross

Checkmark

Checkmark

Technical error impact on revenue (crashes, JS, API, etc.)

Checkmark

⚠️

⚠️

Cross

Cross

Checkmark

Checkmark

Mobile app replay

Checkmark

Checkmark

Checkmark

⚠️

Checkmark

Checkmark

Checkmark

Privacy & masking controls

Checkmark

Checkmark

Checkmark

Checkmark

Checkmark

Checkmark

Checkmark

Enterprise governance & collaboration

Checkmark

Checkmark

Checkmark

Checkmark

Checkmark

Checkmark

Checkmark

Smart Capture es una función imprescindible para nosotros. Gracias a ella, ahorramos un montón de tiempo, evitamos errores de seguimiento y podemos concentrarnos en analizar datos, y no en cómo configurarlo.

Sarah Lacroix
Global Head of Product Design, Criteo

Con Smart Capture, aunque me olvide de etiquetar algo, sé que CSQ lo ha capturado. Tampoco me preocupa que me surjan preguntas a los dos meses, porque sé que los datos van a estar ahí.

Matthew Gomes
Director of Marketing, OppLoans
John Lewis & Partners
+
1032
2
4157
7
,
8493
3
%

de aumento de la interacción con los banners de campañas.

Leer más
Rhone
+
0133
3
7547
7
%

de superación de objetivos y aumento interanual de las ventas.

Leer más
EasyJet
+
4857
7
,
6493
3
%

de aumento de los ingresos con uno de sus recorridos del cliente.

Leer más
Ocado
+
2796
6
3270
0
%

de aumento de la media mensual de usuarios de Contentsquare.

Leer más
Admiral
+
1201
1
1405
5
%

de aumento en la puntuación de los resultados de los análisis de QA (del 85 % al 98 %).

Leer más
  • Descubre cómo se comportan tus usuarios y pasa a la acción

    Visualiza el comportamiento de tus usuarias y usuarios en cada página. Luego, haz las mejoras necesarias en el contenido para obtener las máximas conversiones e interacciones.

    Descubre Experience Analytics
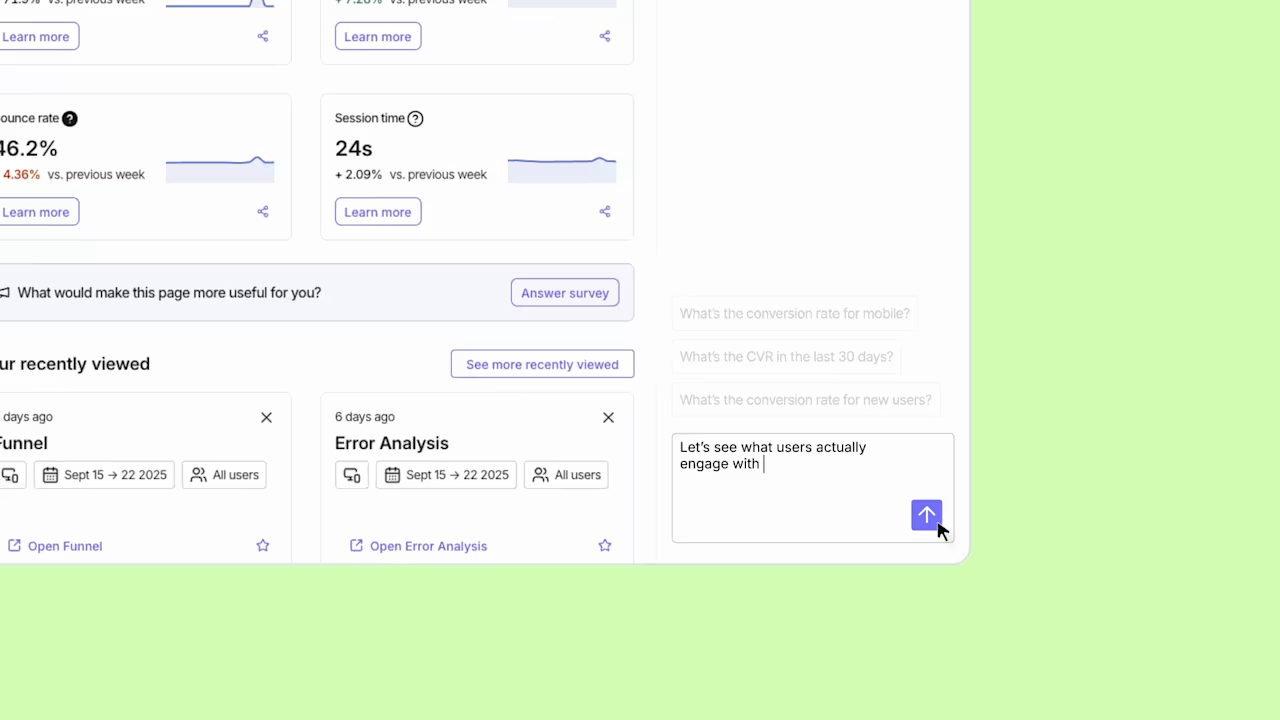
    Experience Analytics Thumbnail
Convierte los insights en crecimiento