![[Asset] WhistleOut Cover Image](http://images.ctfassets.net/gwbpo1m641r7/5K4uXBMl94KlypcvfsPkmx/8d2fab4d2bd3a46cb74f49851a130392/surface-8HPLpr3hebU-unsplash.jpg?w=3840&q=100&fit=fill&fm=avif)
As we live our lives increasingly online, it’s crucial for brands to understand how customers behave. Every click or scroll tells us something valuable about what customers like and don’t like, as well as their intentions online. By paying attention to these clues, brands can make better decisions, create more personalized experiences, and grow their business. But this is not always easy, despite the wealth of tools available online.
We sat down with Jacqui Dent, Digital Optimization Specialist at WhistleOut Australia., a cell phone and internet plan comparison site, to find out how her team leverages the power of digital experience analytics to drive experimentation efforts and save time.
The challenge
What are some of your key digital challenges?
As part of the UX & Optimization team, my job is to find opportunities to increase conversion rates and the on-site experience for users. I use digital analytics, A/B testing, and Contentsquare to understand how and why users interact with different parts of our site—or don’t in some cases! WhistleOut has been in the mobile and internet plan comparison space for 16 years and we have a huge audience for our tools and content. However, as a mature website, new audiences are harder to come by, so to continue growing our business, we need to focus on improving the experience for our users.
We’ve built some comprehensive tools to help people compare mobile and internet plans. But comprehensive can also be complex. What we want to do now is hone in on what features really help our users, and help people find them as quickly and use them as easily as possible.
Before Contentsquare, we used analytics and other more conventional heat mapping tools to try to understand what was and wasn’t working for our users. But they either didn’t provide the level of granularity that we needed, or they weren’t technically advanced enough to work well with our site.

The solution
How does Contentsquare help to solve these challenges?
Before Contentsquare, we used analytics and other more conventional heat mapping tools to try to understand what was and wasn’t working for our users. But they either didn’t provide the level of granularity that we needed, or they weren’t technically advanced enough to work well with our site. Another problem was that these tools weren’t “always on”, which meant if we realized we needed information about a page, we would have to set up some monitoring and then wait several weeks or more for data to accumulate before we could do our analysis.
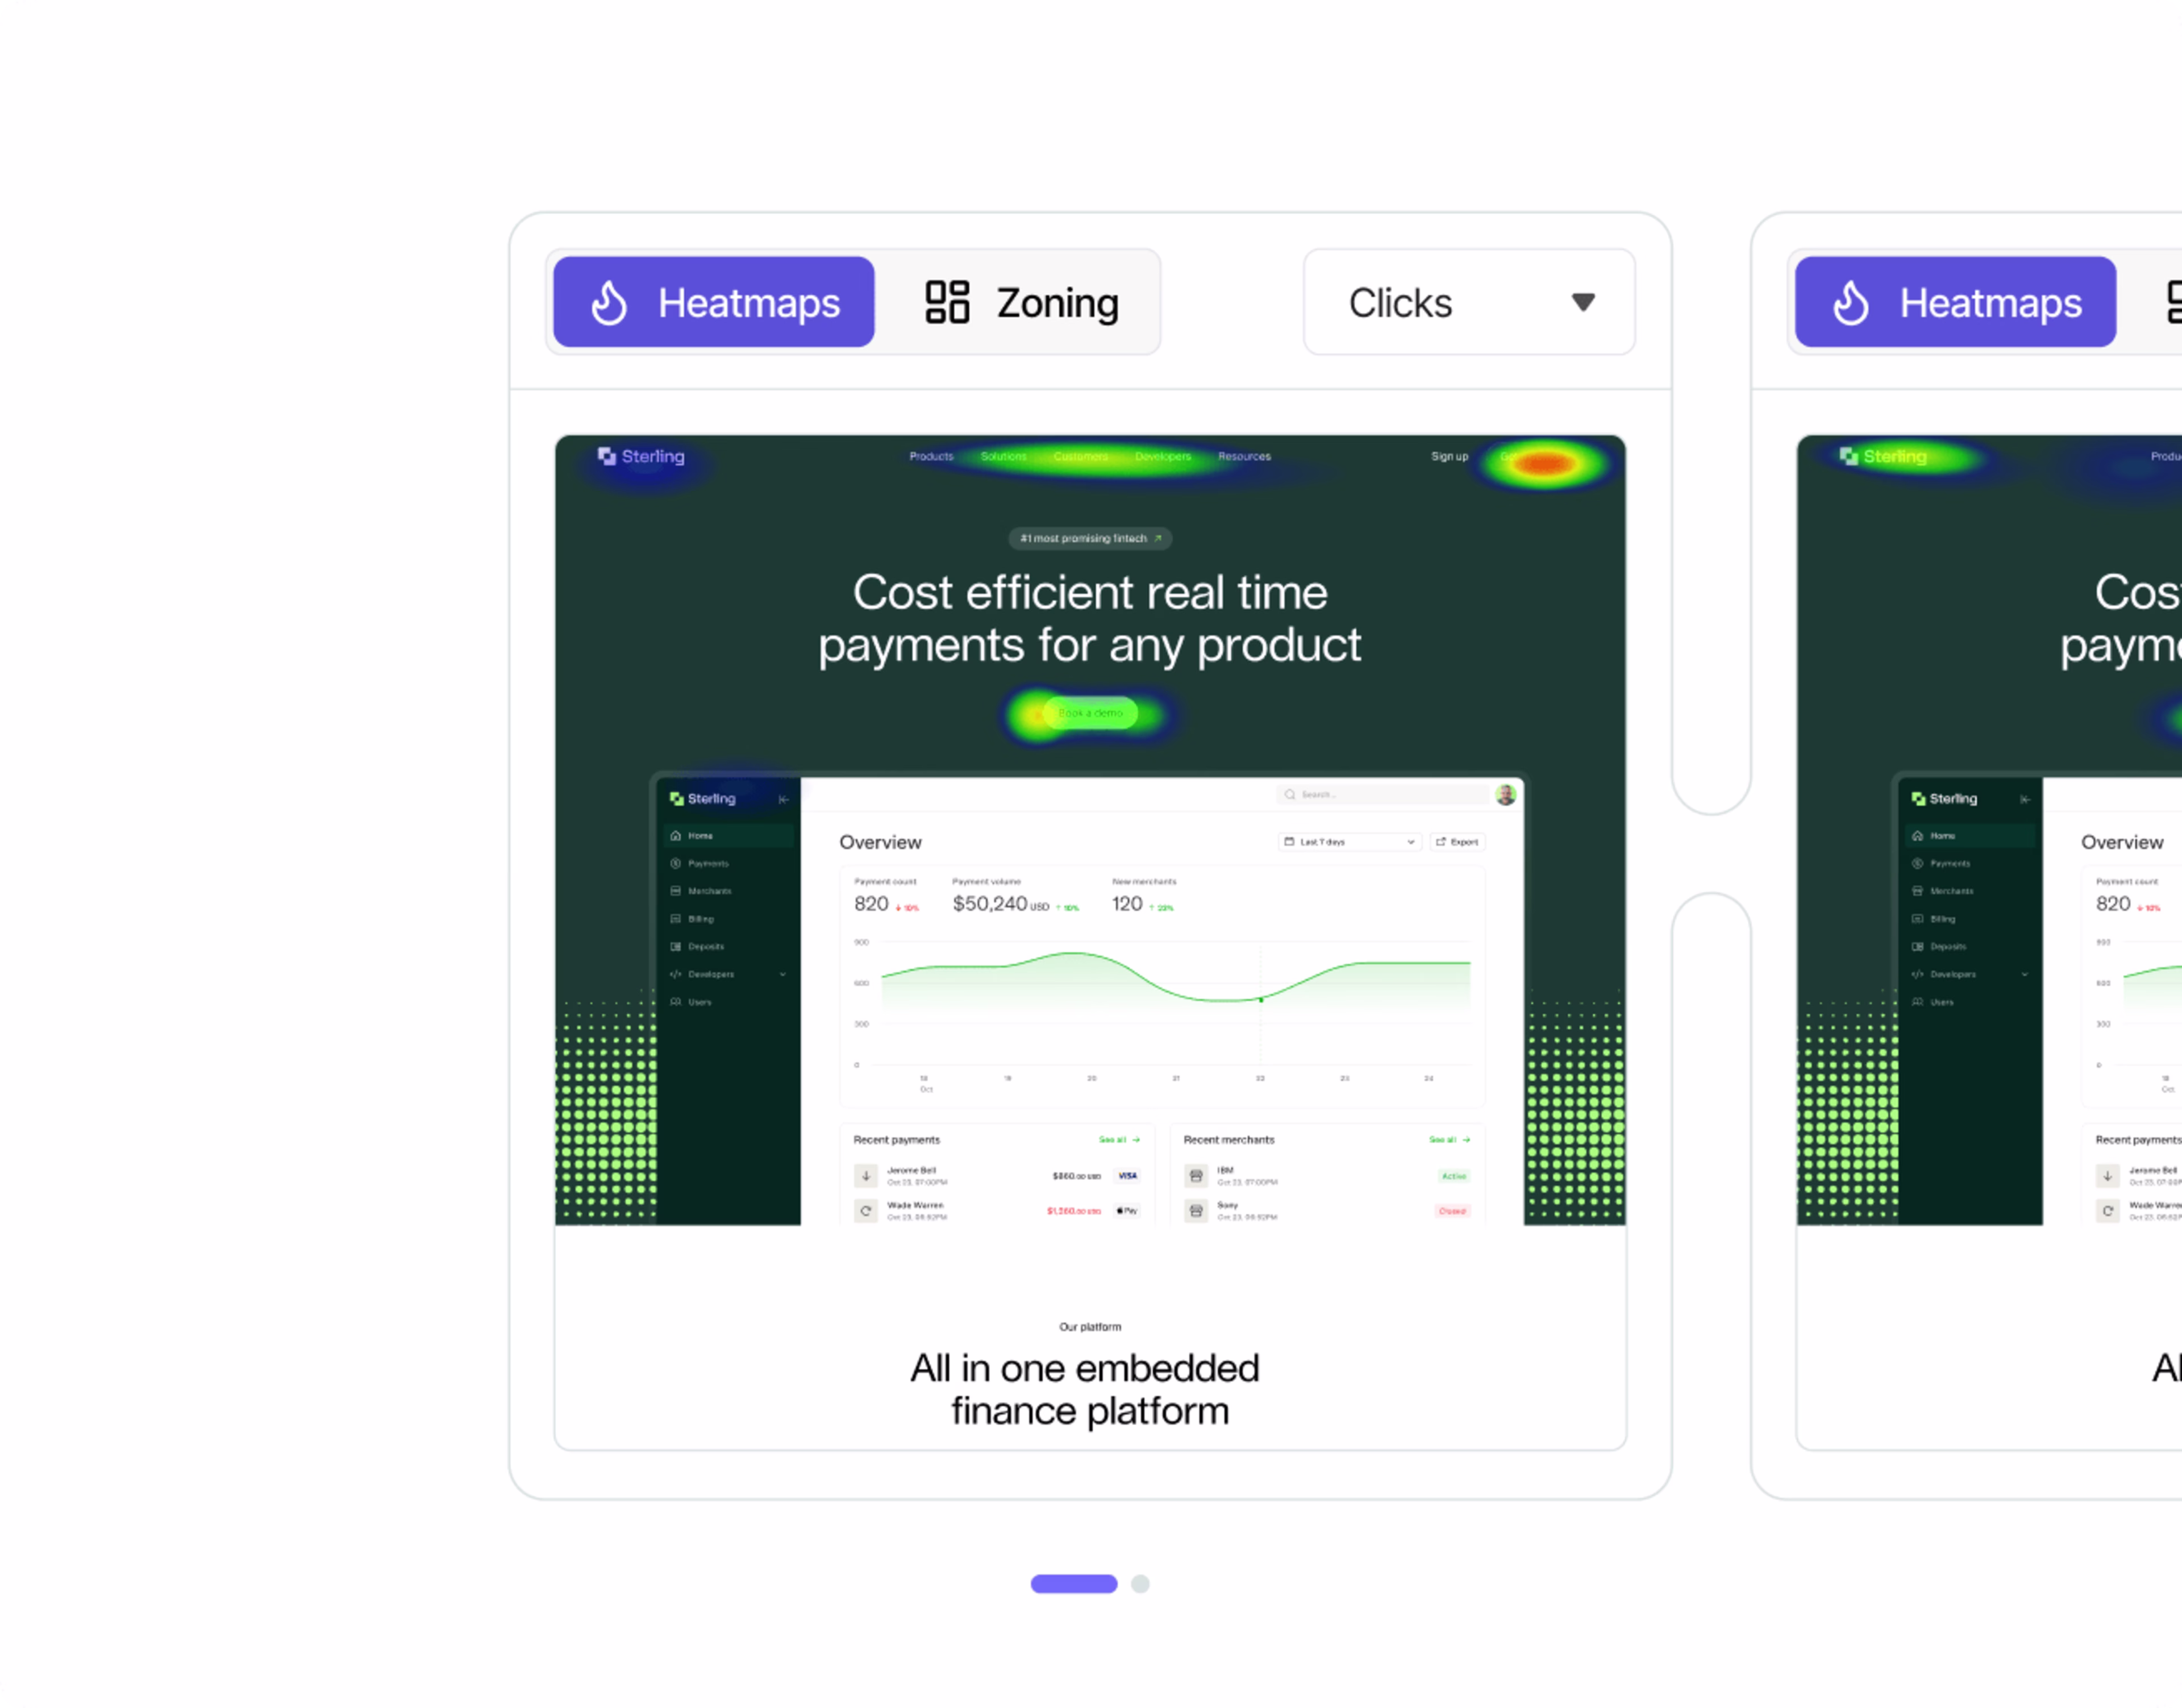
Now if we have a question about how users are interacting with a particular tool or page, we can get the information straight away. We can see not just what users are or aren't clicking on, but also information like how attractive it was to users, the time to first click, the exposure rate, and even the revenue generated to really build up a picture of what’s going on.
We’ve discovered elements buried at the bottom of our pages that look like they’re actually way more interesting to users than we’d imagined. We’ve been able to gain a better understanding of what users seem to be looking for on each page, so we can help them find it more easily. We can direct our time and effort towards what works for our audience and avoid devoting time and resources towards what doesn’t.
Example of Contentsquare's side-by-side analysis view
We can also dig deeper into the results of A/B tests that we run on-site. Whereas before, with our A/B testing tool we’d be able to see whether one variant out-performed the other, we wouldn’t get much information about why. Now that we have Contentsquare, we can use Journey Analysis on the test original and variant to see a detailed picture of user behaviour on each variant and identify where it’s different to figure out what’s driving the results we’re seeing.
Now that we have Contentsquare, we can use Journey Analysis on the test original and variant to see a detailed picture of user behaviour on each variant and identify where it’s different to figure out what’s driving the results we’re seeing.
Can you share some win(s) you’ve achieved with Contentsquare?
One of the biggest wins is just the level of information about our user behavior that we now have access to—without having to do lots of digging into reports, setting up tracking, waiting and then making guesses based on the limited information that comes back. We’ve saved ourselves a tons of time on data hunting, and we’ve avoided going down a few rabbit holes because we can now easily see what’s worth our time to pursue.
A big part of this has been our mobile and internet plans search tools. We’ve never had a heat mapping tool sophisticated enough to work well with this before. These tools are rich in filters and functionality, but until recently we had very little data on how users were actually engaging with these.
Contentsquare has very quickly given us solid numbers on what buttons and filters are being used the most and their impact on conversion rates. We’ve been able to use these insights to guide our A/B test plans. And after the tests are finished, of course, we can jump back into Contentsquare and analyze the results, to get more insight. All of this helps us to refine and iterate on the search tool design, which is pretty exciting.
Contentsquare has very quickly given us solid numbers on what buttons and filters are being used the most and their impact on conversion rates.
Which teams at WhistleOut use Contentsquare?
Obviously, the primary users are my colleagues and me in the UX & Optimization team.
However, we also have Contentsquare users within the Marketing, Editorial, and Product teams at WhistleOut. CS Live and Journey Analysis are the most popular Contentsquare features outside the UX team. Team members use it to understand which parts of the pages they’re responsible for are driving clicks and engagement, as well as possibly under-utilized elements using the attractiveness rate.
![[visual] Journey Analysis - Segments break down by behavoir or browser](http://images.ctfassets.net/gwbpo1m641r7/5Muy4j91VHoE05F9aR8zRE/a49f9b2919b7e0fdbcfcd9f7b9a73c09/eyJwYXRoIjoiY29udGVudHNxdWFyZVwvZmlsZVwvVWlVb3V1SmtzdFNxeDRHZlFIVDguc3ZnIn0_contentsquare_uVIAMsfg-SoMfrK7iC5NKgnOIw9_DomMb3.svg?w=3840&q=100&fit=fill)
Contentsquare's Journey Analysis capability
The teams use CS Live and Journey Analysis to analyse organic SEO content, landing pages for our paid advertising, product pages and other areas of the site. It’s taken out a lot of the guesswork when understanding user behavior.
The impact
What do you think is the biggest value Contentsquare offers?
I really love how it democratizes UX data and analytics across the business. CS Live is a tool that absolutely anyone can learn to use, and accessing it is so quick and easy that anyone with the inclination can jump in and gain deeper insights into how our users are behaving on individual pages. So no one needs to rely on hunches or wait for the team to investigate and get back to them.
There’s also just so much information to dig into. If you want to deep dive into a problem or a question, you can do that. Or if you need a quick answer, it can do that too.
If you were to recommend Contentsquare to a peer, what would you say?
Now that I’ve used Contentsquare, I would feel blind without it. I think once you’ve mastered the basics of UX and optimization, it would be hard to get to the next level without a tool like this.