
The company
OLLY is an American vitamin and supplement brand with a mission to champion better well-being for all. The company is known for its bold branding and fun chewy gummy supplements, which stand out from traditional supplement brands.
Jennifer Peters, Director of DTC, Martech, and Digital Compliance at OLLY is responsible for driving their direct-to-consumer business growth and champions the fusion of technology and marketing for top-notch digital experiences.
The challenge
Jennifer’s team needed a platform that would help them improve campaign landing pages by building them around who their customers are, considering their expectations and needs. Understanding their customers’ objectives and where they are in the customer journey was a top priority for Jennifer.
“You have to put them first no matter what, and you have to connect their journey. Meet your customers where they are. Whatever you do, always reflect what customers want. Be where your customer is, and try to look at everything through the customer's eyes,” she says.
The solution
To better identify what really adds value to customers, Jennifer decided to embed the Contentsquare's Experience Intelligence platform into their campaign optimization process. 2 weeks after launching a new campaign landing page, Jennifer’s team used the platform to analyze every single element on the page, looking at key metrics like user frustration and attractiveness rate.
Since building the platform into their optimization process, the team has gained invaluable insights that allow them to take the right actions to improve campaign page performance. Jennifer shares 2 key examples of the optimizations they’ve made using the Contentsquare platform.
One of my favorite things is the attractiveness score, which shows where we've missed out and where we've gone wrong. It’s such a great tool help us understand where the customer is on the page and what they like and don't like. Contentsquare has been a huge help for us to overcome our challenges.

1. Increasing subscriptions on PDPs
Analysis in Contentsquare's Heatmaps capability showed a high exposure rate (51%) on their subscribe & save section, however the tap rate (1.15%) in the same section was low. The tap rate on the delivery section was also low, at 0.91%.
Further analysis revealed a high hesitation time of 1.82 seconds on the same subscription delivery selection, indicating that users might not immediately have understood the subscription service or options.
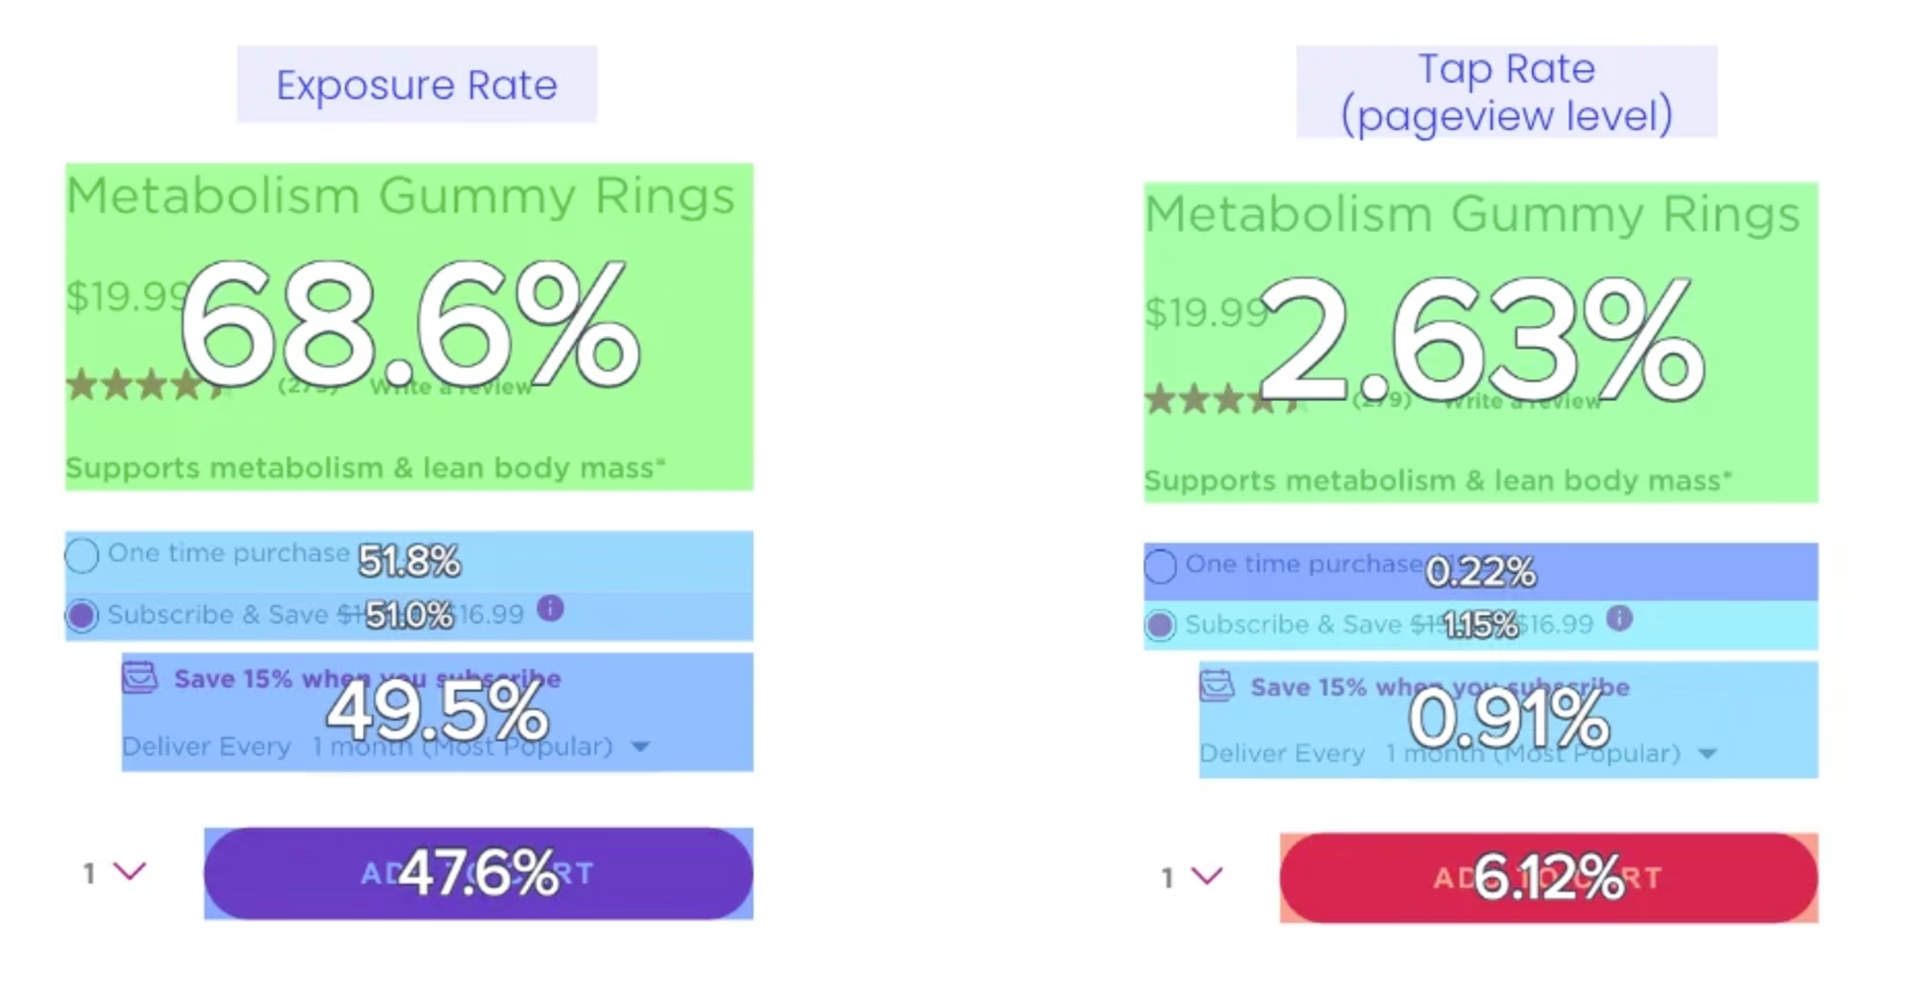
Heatmap analysis of OLLY's subscribe & save section showing exposure rate (left) and tap rate (right)
The recommendation: Provide users with peace of mind by including subscription details in product detail pages (PDP) copy. For example, “You can cancel anytime."
2. Growing new product categories on fitness landing pages
Contentsquare's Journey Analysis capability revealed a high exit rate on the company's fitness landing pages. Products seemed to be low on the page and the page had more copy elements than call to actions (CTAs).
Further analysis also showed fitness pages were one the highest performing pages, with 2.39% conversion rate.
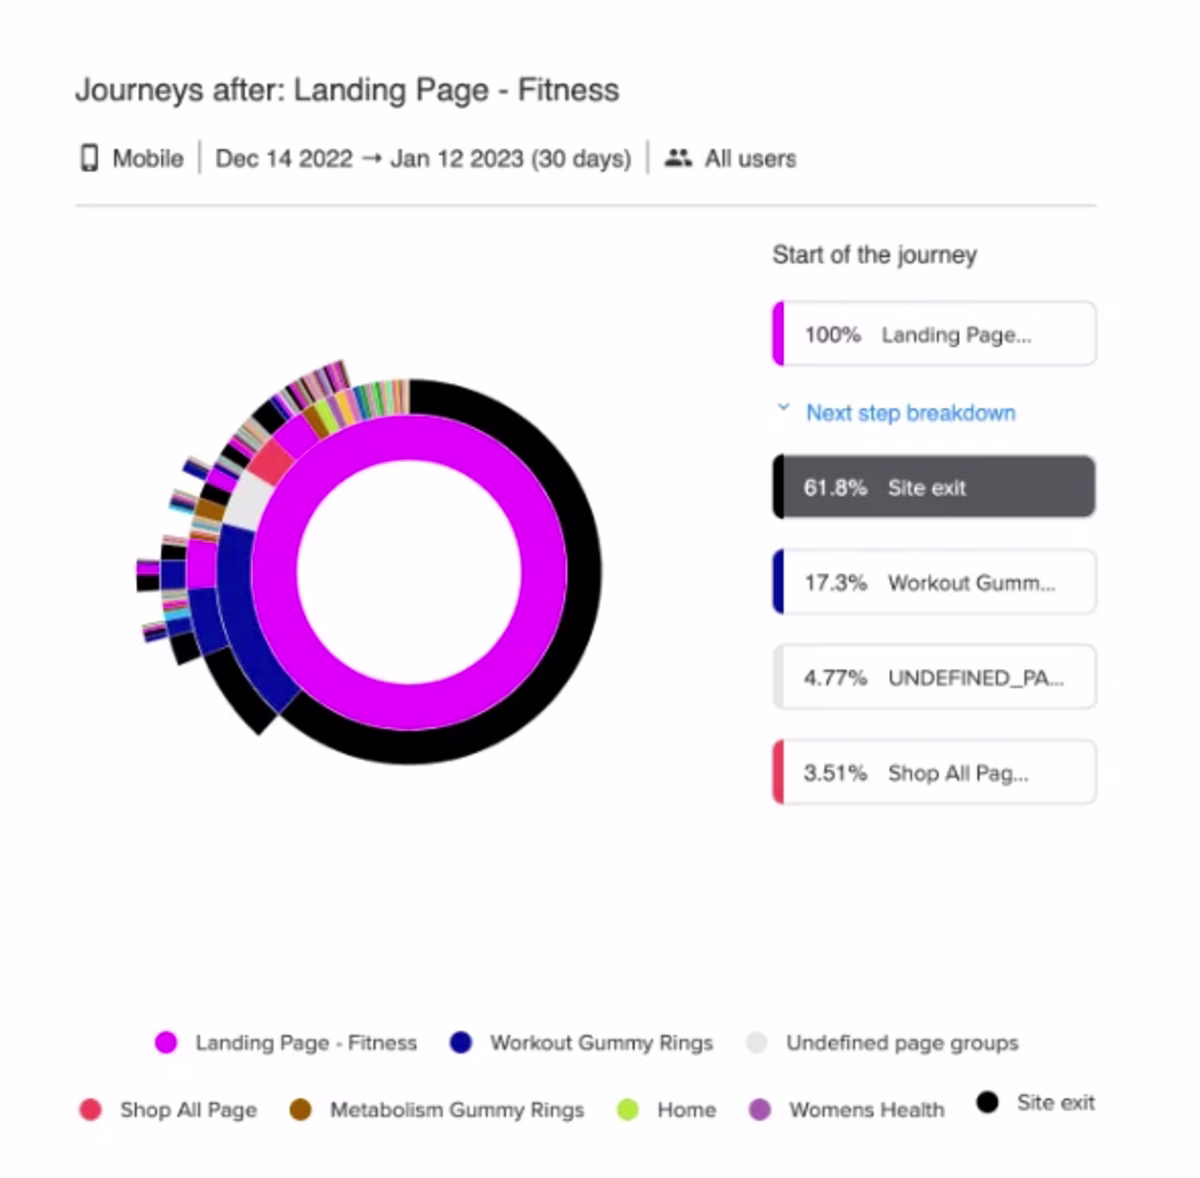
Analysis of OLLY's customer journey on their fitness landing pages shows a high exit rate
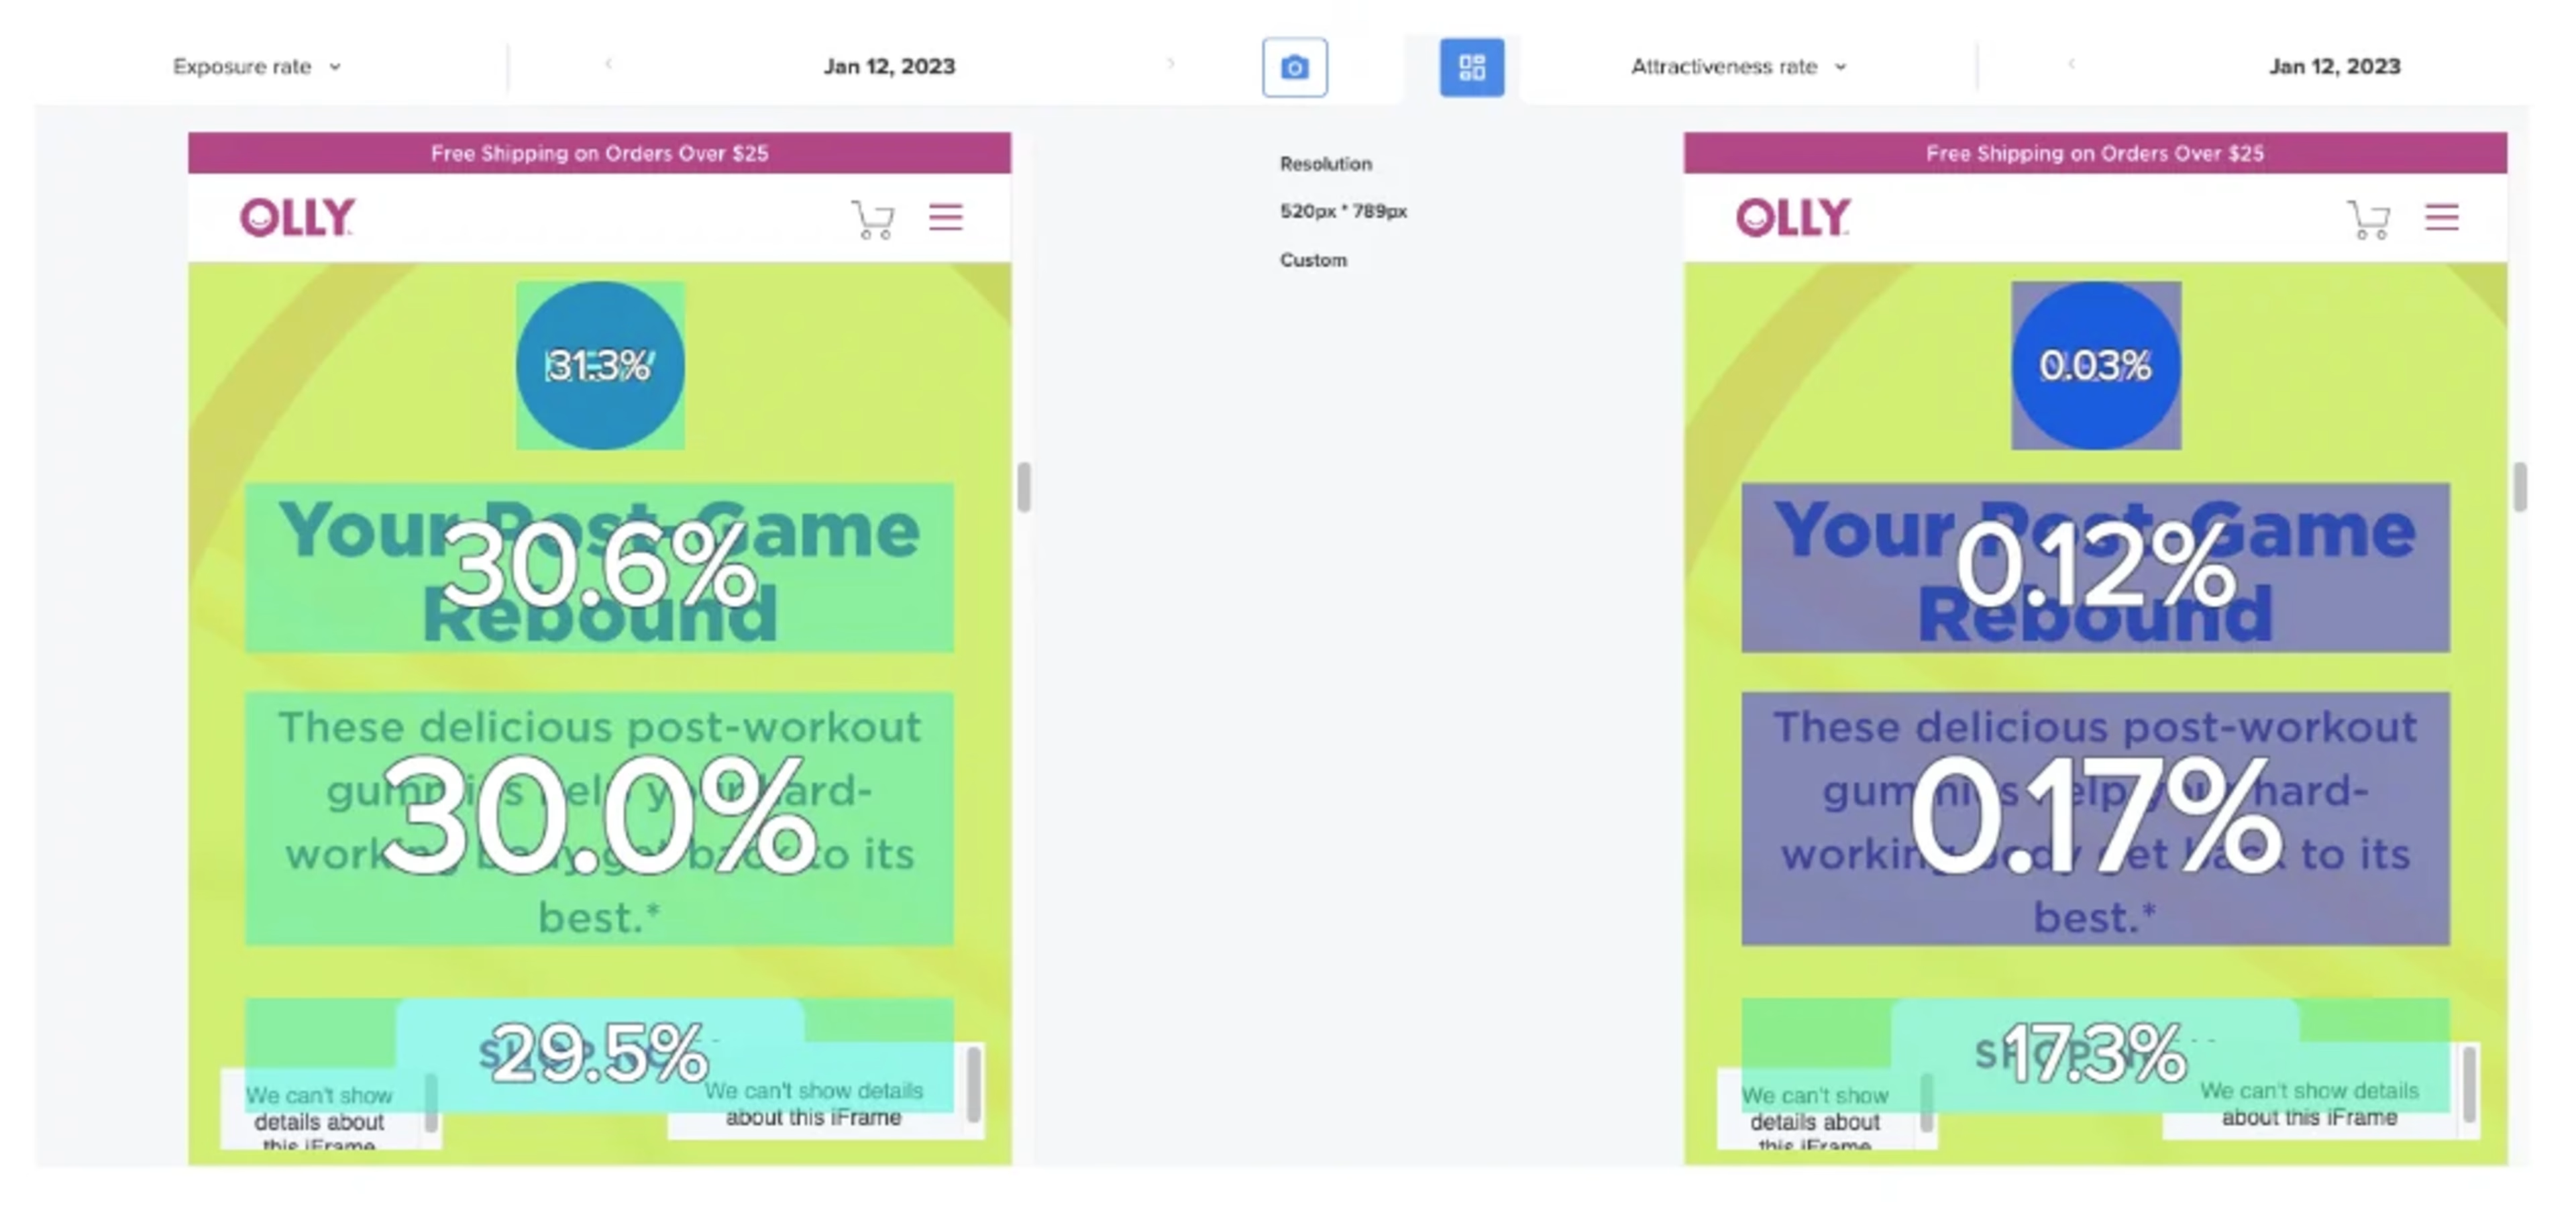
Heatmap analysis of OLLY's page CTA shows a low exposure rate (right) and a high attractiveness rate (left)
A deep dive using Heatmaps also showed that OLLY’s workout gummies and 'Tin Deal' had the highest revenue and attractiveness rate on the page.
However, the exposure rate of these products was low (40% or less).
The recommendation: Bring shop CTAs and the highest revenue products like the 'Tin Deal' further up the page.
Customers vote with their wallet. They vote with their behavior, and you have to be able to react to that quickly and not put your own preferences and bias ahead of what the customers are actually telling you.

The results
With the Contentsquare platform embedded into OLLY’s campaign optimization process, the brand has been able to improve its user experience, seeing a significant boost in business results including
+20% increase in website revenue (month over month)
+91% increase from month to month at the start of the year
+3% increase in average order value (AOV)