
The company
Motorpoint is the U.K.’s leading independent retailer of nearly new and used cars. Having first opened its doors in 1998, the company now operates 20 stores across England, Scotland, and Wales.
In addition to its retail stores, Motorpoint has a robust online presence. The company's website lets you browse, reserve, or buy vehicles online, chat live with a sales representative, or inquire about a car via email or phone.
Martin Wood, UX analyst at Motorpoint, shares more about how he uses Contentsquare to optimize the customer’s digital journey.
Motorpoint's website
The challenge
With a small digital team and limited resources, Martin needed an easy way to empower data adoption, improve reporting to leadership, and combine different data views.
“We use different bits of tech to piece together how our website is working,” says Martin. “We’d spend time combining those different bits to try and create a story. But what if you could do it all in one place?”
The solution
To achieve a centralized and holistic view of the Motorpoint website, Martin and his team built a custom dashboard in Contentsquare and started using Contentsquare's Experience Analytics to analyze the peformance of A/B tests on their website.
Tailored dashboard to align teams
The dashboard in Contentsquare was also intuitive, offering Martin and his team a high level of personalization. He could select the type of visualization he wanted (Ex: a line chart or a page visualization) and choose where to position it on the dashboard, making it functional and easy to understand.
“Our dashboard has a lot of data visualizations,” says Martin. “But with Contentsquare, it's very easy to hide and show what you need. And once you get used to it, you start to understand it.”
The new dashboard lets the Motorpoint team
Keep key metrics top of mind: a general overview at the top contains data like page views, bounce rate, and session times
Track website performance: the website’s overall performance and speed metrics appear on the dashboard because they impact both the user experience (UX) and SEO
Monitor browsing: to assess UX performance, the team included browsing metrics, on-page behaviors, and user interactions
View outcomes: line graphs and bar graphs show progress toward the website’s goals, like lead generation and content performance
Analyze results in-depth: with filters, users could segment the data (for example, by traffic type) to surface new insights and optimize content accordingly
Within the Contentsquare platform, it’s very easy with just a few clicks to start looking at the impact we’ve made—whether it’s seeing what happened before and after a new release, or to compare last year’s performance to this year.

Quickly analyze A/B tests
The Motorpoint team also found Contentsquare's Experience Intelligence platform made it easy to analyze A/B tests and report that data in a consistent way via an AB Tasty integration.
The Contentsquare-AB Tasty integration allows the Motorpoint team to dive deeper into test results by using Heatmaps to understand where users click and tap and Session Replay to watch recordings of their page interactions.
The results
The Motorpoint team now has a seamless dashboard for measuring and reporting on site performance, allowing them to
Reduce reporting time by -75%
Offer self-serve access, resulting in 5x more users engaging with website data in Contentsquare
Quickly see the impact of A/B tests and feature releases and segment their performance
Easily answer business queries and provide insights to leadership
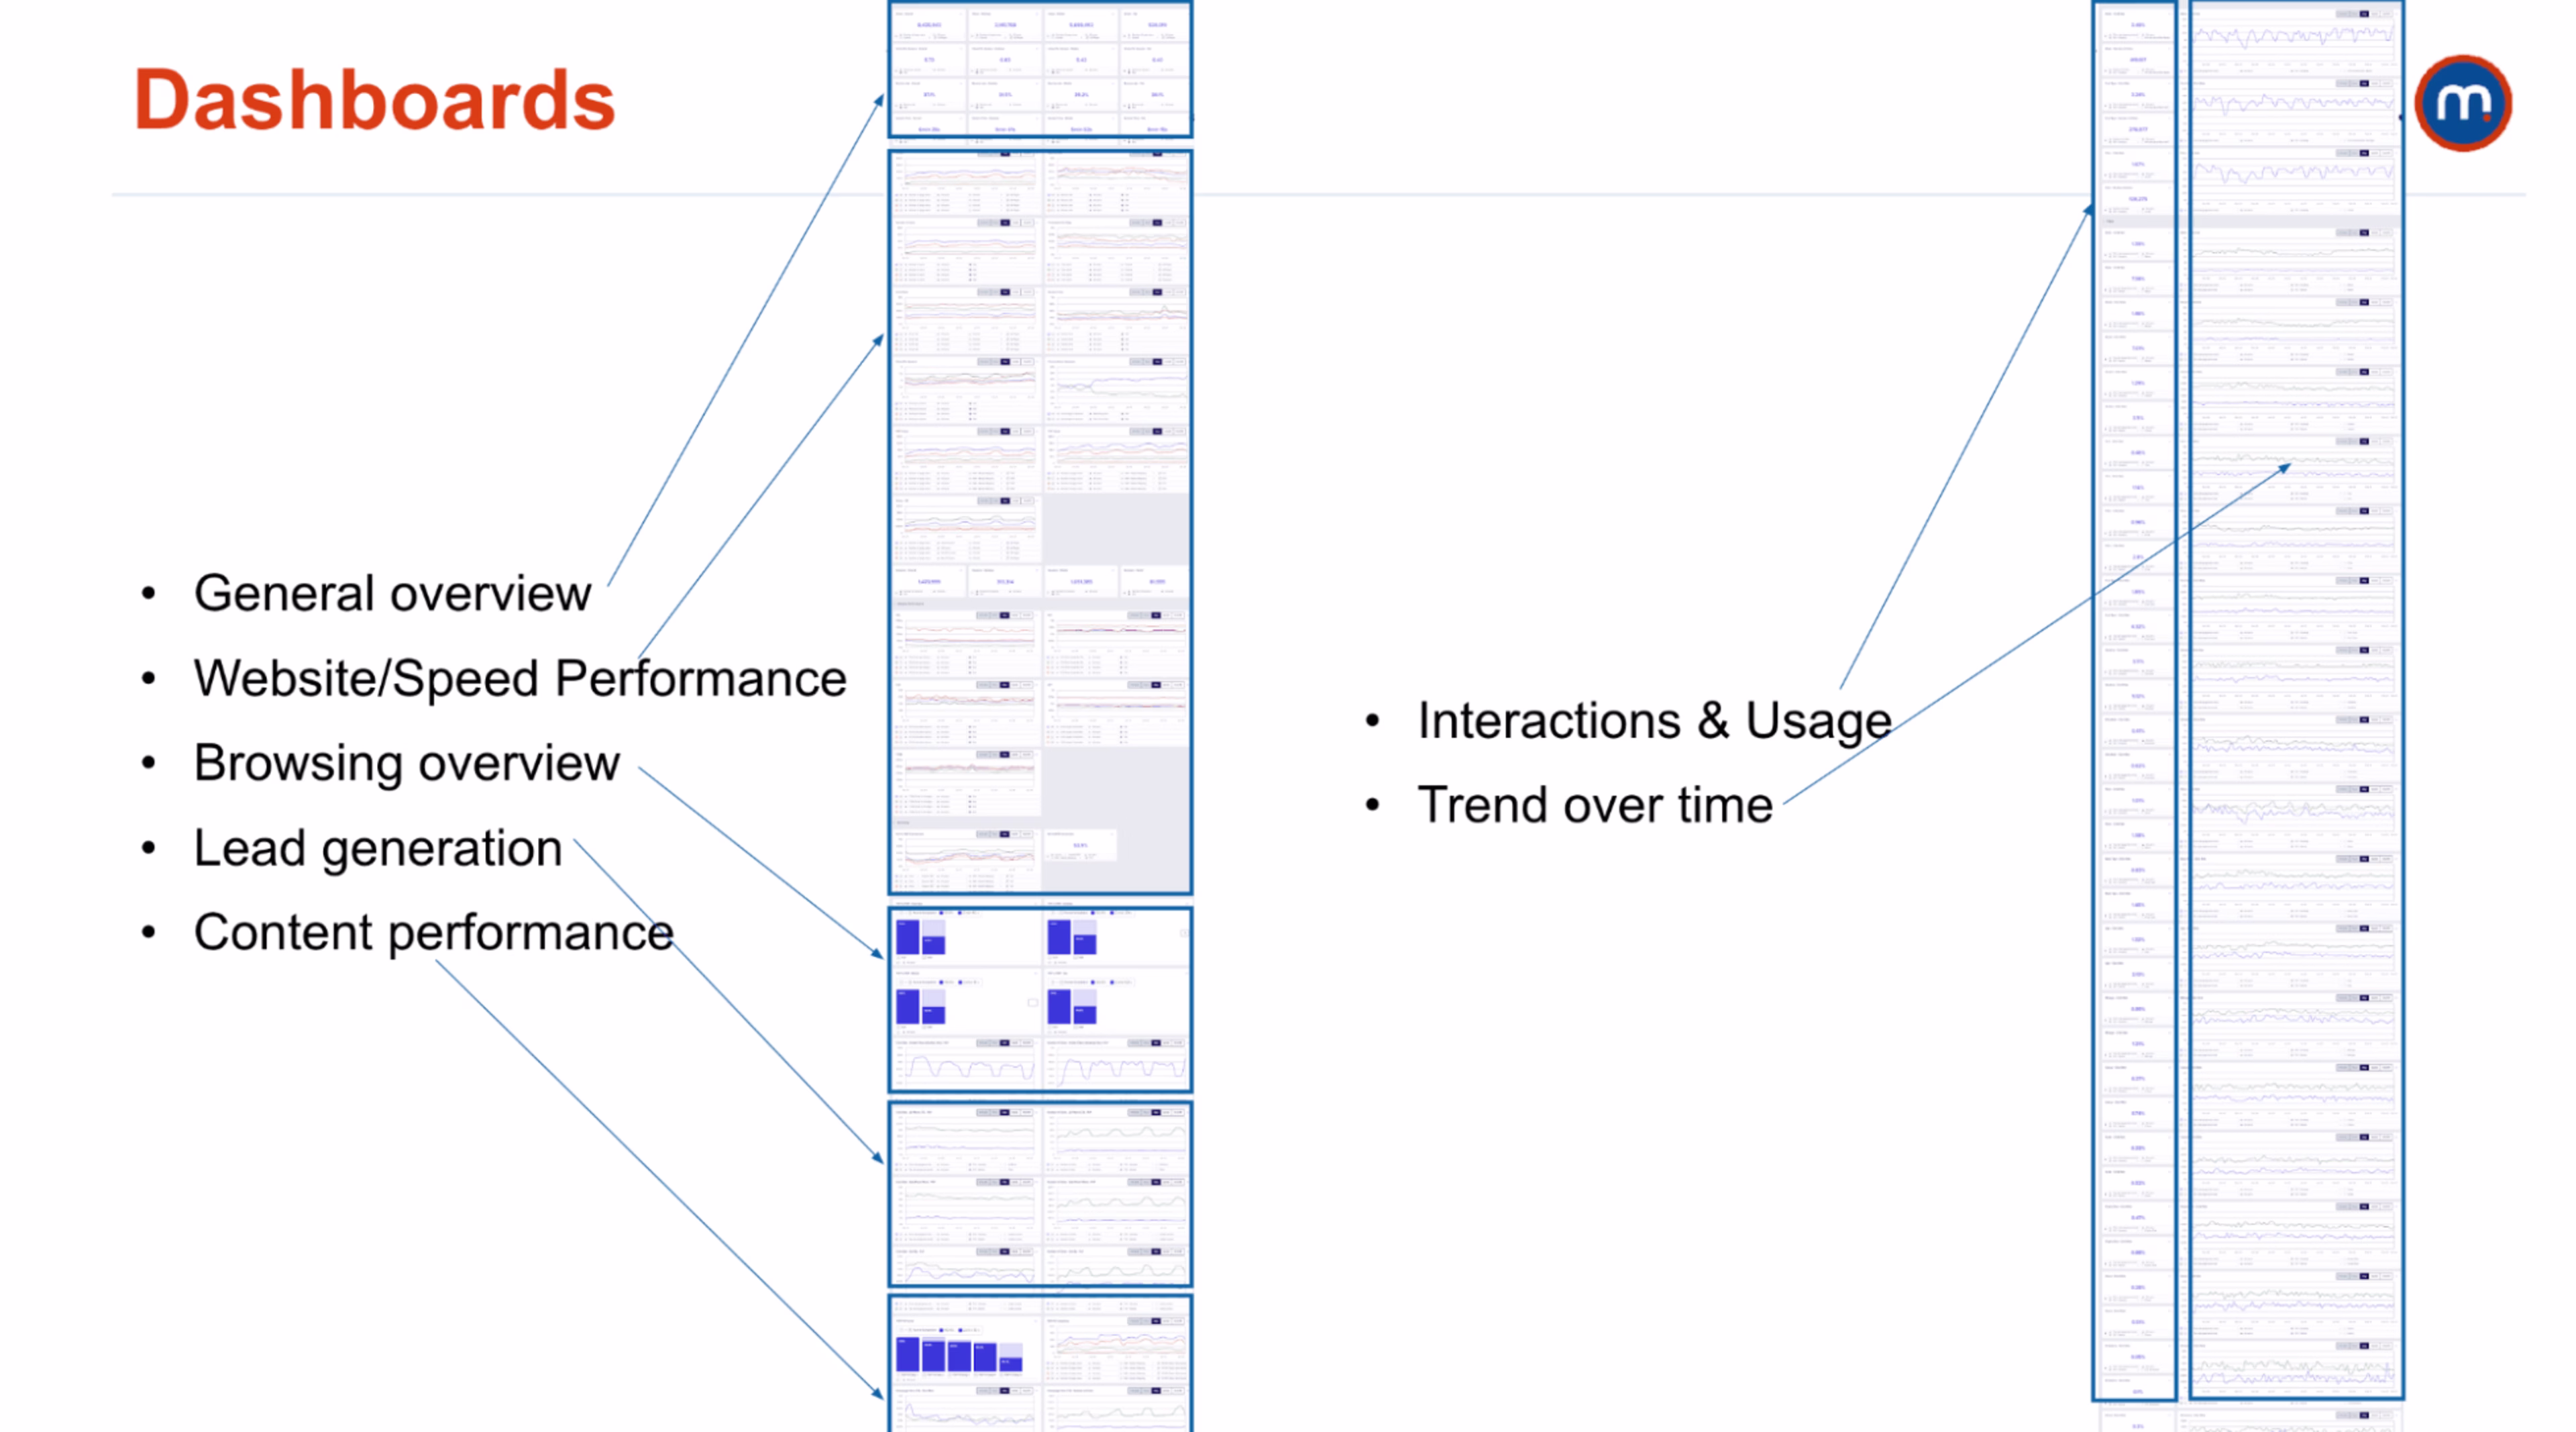
A breakdown of Motorpoint's custom-built dashboard in Contentsquare
Dashboards cut out our reporting time, have helped us engage with other team members, and bring more people onto the platform.

What's next
With the success they’ve had with Contentsquare, Martin's team continues to look for new ways to use the platform.
“So, we've built all of this now, but how do we best use it?” Martin asks. “How can we make sure that we don't have to check our dashboards all the time?”
To take a hands-free approach, Martin's team plans to set up AI alerts to get notified when their business metrics fluctuate from what’s typical.