In today’s digital age, having a holistic understanding of the customer journey is crucial if brands want to be able to design and deliver seamless experiences. No one likes a website or app that’s tricky to navigate – think about the last time this happened to you. You likely abandoned your journey. Brands typically only have one shot at converting, making it crucial that visitors have a great experience on your digital channels from the moment they land on your site, all the way through to check out.
Part of enabling that great experience is experimentation. Experimentation helps identify what works best, enabling personalization while fostering innovation. This iterative process ultimately enhances long-term loyalty and helps brands maintain a competitive edge in the digital landscape.
What is an “experimentation platform” ?
An experimentation platform is a digital tool or system that enables organizations to conduct controlled tests and experiments to optimize various aspects of their operations. It provides a structured environment to test hypotheses, analyze data, and make informed decisions based on the results. This platform typically allows users to design experiments, define variables, set up control groups, and measure outcomes in a controlled and efficient manner. The goal is to gain insights into user behavior, product performance, or any other relevant metrics, ultimately leading to data-driven improvements and enhancements across products, services, or processes.
Interview with nib on the importance of understanding the customer journey and how they’re driving experimentation with Contentsquare
nib is one of Australia’s leading insurance brands, providing health and medical insurance to over 1.6 million Australian and New Zealand resident, in addition, to over 200,000 international workers and students who rely on nib for their health insurance cover. Today they also provide travel insurance, and they support almost 40,000 participants in Australia’s National Disability Insurance Scheme. nib’s mission is to support the better health and wellbeing of its members, participants and travellers. They aim to do this by enabling access to a wide ecosystem of “personalised” products, programs and healthcare services to complement our private health insurance, all available on their content-rich digital platform.
It goes without saying that an intuitive platform is crucial in enabling visitors to navigate through all that information and finding what they need easily.

We sit down with Clare Powell, nib’s Senior Manager Digital Growth and Performance to learn more about how they’re using digital experience analytics platform Contentsquare to help them better understand the customer journey and drive experimentation programs to improve the digital experience.
Hi, please introduce yourself
My name is Clare, and I’m the Senior Manager Digital Growth and Performance at nib. I’m responsible primarily for growing website leads and website sales. On a day-to-day basis, I lookafter the digital analytics function of the website, as well as experimentation and A/B testing, and optimising the online experience.
What are some of the key challenges you face when it comes to the digital experience?
Where we were struggling is we had a lot of data that told us what was happening, but not why. For example, we would look at a certain page and could see that visitors weren’t doing what we wanted them to, but didn’t understand why this was the case. We were doing a lot of guesswork in terms of what were the next steps, or what we should optimise next.
How does Contentsquare help to solve these challenges?
How do I put into words, my love for this platform?
We were using Universal Analytics prior, and some of our teams were having trouble using that to gather insights . Now that [we have Contentsquare], we’ve got for example, content editors who are able to go[into the platform] and access very granula data.
And I think that granular detail is the key benefit. At a page level, it’s not just how the page is performing overall – it’s getting into the nitty gritty of the individual elements, including “the why”. We’re not just able to understand who’s clicking on what, but we’re able to get metrics like attractiveness, rate, exposure which gives us a holistic view.
When it comes to customer journey mapping, Google Analytics makes it very easy to build out a funnel or a journey path, but these are journeys you need to plan for.
That’s the appeal of that sunburst diagram that Contentsquare has – it uncovers journeys that we didn’t know about.
Can you share an instance where you saw results from your experiments with Contentsquare?
We use Optimizely as our experimentation tool, and the results can sometimes be quite topline. There have been instances when we combined those results with Contentsquare and were able to gain context to the data, which led us down a better and more informed direction in terms of the next steps.

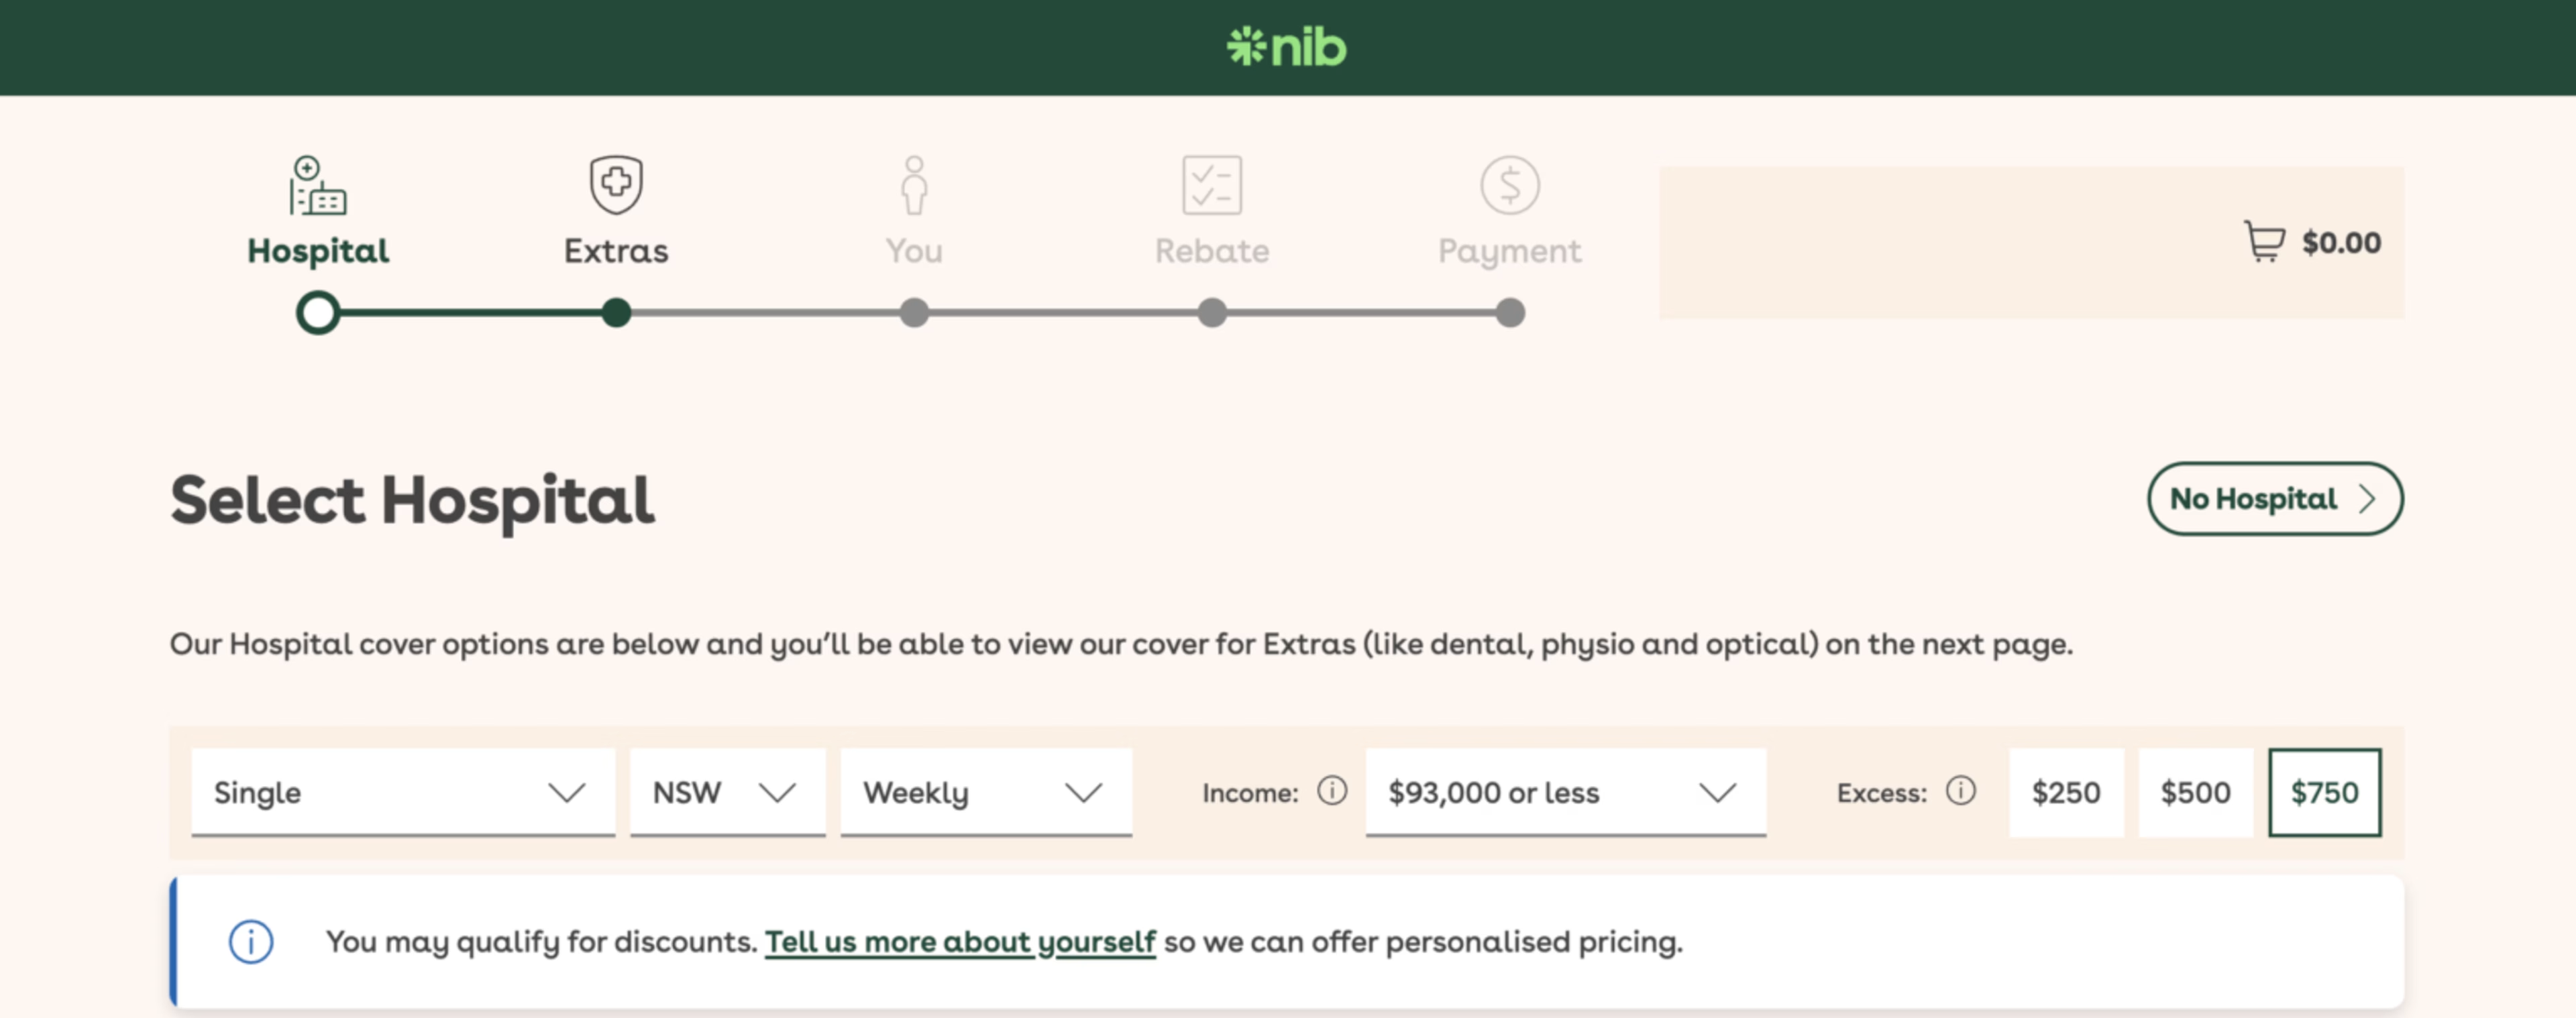
A current experiment we’re working on is our filter bar. You can filter by your life stage, state and what you want your health insurance premium excess to be. We tested adding an income filter, which gives you a more accurate quote. Optimizely showed us that the segment of visitors who saw the income filter bar converted less. From these initial findings, we thought that inputting income causes the price to jump, which then causes potential customers to abandon their journey because they’re after the lowest price.
What we were able to drill into with Contentsquare was to understand the difference between the segment of users who saw the filter bar and interacted with it, vs those who saw it but didn’t interact with it. What we actually found was the opposite of our initial thoughts on the user experience, and instead, we found that the people who were interacting with the filter bar actually converted quite a bit higher than those who weren’t.
Our hypothesis is no longer price shock, but now around, how can we better place the element? Or how can we better explain the benefit of filling in the income field so your quote is more accurate?
What other teams at nib use Contentsquare?
So we’ve got, my team, that is, the digital growth and performance team. And then we’ve got our IT team, where our UX designers sit. DevOps use it to look for errors, as well as our content and marketing teams who look after our blog & general information pages and who also track customer journeys on marketing landing pages. We have regular meetings with these teams for ideation sessions from the insights we collect from Contentsquare, and to better understand as an organisation what worked, and what didn’t to help guide the next steps or inspire new experiments.
What made you choose Contentsquare?
It was really how easy the UI was for us. Knowing that we didn’t have a lot of resources, we needed a platform that enabled as much self-service as possible. We also needed a platform that would seamlessly fit in with Tealium, and as we’re in the finance space, we needed something that met all risk, compliance and security requirements.
It would be hard to ever go back now that we’ve used Contentsquare!
Finally, why do you think it’s important for brands to care about the digital experience?
I think the digital experience is everything, and it’s becoming the voice of the brand. In the old days, it might be a TV advertisement that would set the tone of what your brand is. Whereas now, people typically first encounter your brand after they Google it.
There’s also a theory that if your website is really hard to use, there’s a psychological assumption that dealing with the company will also be hard. And, this is especially so with a product like private health insurance, where it’s a long-term product. It’s not like you’re buying a pair of shoes, where you may be able to tolerate a clunky platform for the short term. With insurance, it’s something that you may have for the rest of your life and will make multiple transactions for. So, you need that experience to be as simple and intuitive as possible.
![[Visual] Mona Teo-Rubinsztajn](http://images.ctfassets.net/gwbpo1m641r7/4lZdSIiGwmuzhJNCQ1Cf8O/bed8644568b4ac85c00b358fe2ddb7e5/T027K0ZC9-U03PWSVPCLU-47f833761fb3-512.jpeg?w=1080&q=100&fit=fill&fm=avif)
Based in Singapore, Mona is the former APJ Content & Brand Manager at Contentsquare. Outside of work, she can be found reading a book, tucked away in a wine bar, or looking under the couch for one of her four pets.
