![[visual][alternative] Dynatrace](http://images.ctfassets.net/gwbpo1m641r7/79ZVxtYJxGILtb3D7dgELE/d460b864c2b734bc0df3b67195de78c3/Blog-Thumbs-Alternatives__4_.png?w=1920&q=100&fit=fill&fm=avif)
The information on this page is correct as at 13/08/2025 to the best of Contentsquare's understanding.
Dynatrace is great at telling you what’s broken and why. But it doesn’t show how issues have affected users, disrupted journeys, or impacted revenue.
That’s where Contentsquare comes in. We don’t replace everything Dynatrace does—we work alongside it to connect technical issues to real user behavior, frustration, and business outcomes.
In this guide, we walk you through 5 Dynatrace alternatives and show you exactly why pairing any of them with Contentsquare is the fastest way to fix what matters, prioritize by impact, and align every team around customer experience.
Key takeaways
Dynatrace is powerful for system monitoring, but it leaves major experience gaps It’s great at detecting technical issues and tracing root causes, but it doesn’t show how those issues affect users, journeys, or revenue. Its complex pricing, siloed dashboards, and lack of business context make it hard for digital teams to act fast on what matters
There are strong alternatives for backend visibility, but they all face the same challenge Platforms like Datadog, New Relic, and AppDynamics offer deep observability, security monitoring, and flexible integrations. But they’re all built for engineers. They struggle to surface user friction, quantify business impact, or support product, UX, and marketing teams
Contentsquare fills the experience gap every APM leaves behind By integrating any APM with Contentsquare, you get full visibility into both technical and non-technical issues, see how errors affect users and revenue, and prioritize fixes that actually drive growth
Limitations of Dynatrace: why you’re looking at competitors
Dynatrace is a complex observability platform with deep technical visibility. But it comes with major limitations for teams looking to optimize user experience, increase cross-team adoption, and drive overall business growth.
Here are the biggest Dynatrace downsides to consider before choosing an alternative:
1. Complex pricing options
Dynatrace is marketed as a full-stack APM platform, but in practice, it’s a collection of separately priced products. Features like real user monitoring, log management, synthetic checks, and Kubernetes monitoring each live in different pricing tiers. Some are billed per request, others per GiB, and others per hour.
This means that, unless you’re already deep into procurement and forecasting, it’s easy to misjudge what it’ll cost to get full visibility. On the plus side, it does mean that you can use Dynatrace for monitoring and security alongside a better tool for the experience side of things (like Contentsquare’s Experience Analytics) without paying for any overlap.
2. Difficult to prioritize fixes by business impact
Dynatrace is built for detection and diagnosis. It shows you when something breaks, why it happened, and even how many sessions were affected. But it doesn’t make it easy to see what the issue actually cost you. However, if you integrate Dynatrace (or any alternative) with Contentsquare, you can quantify the impact of any issue on conversions and revenue with Impact Quantification and prioritize fixes based on business outcomes.
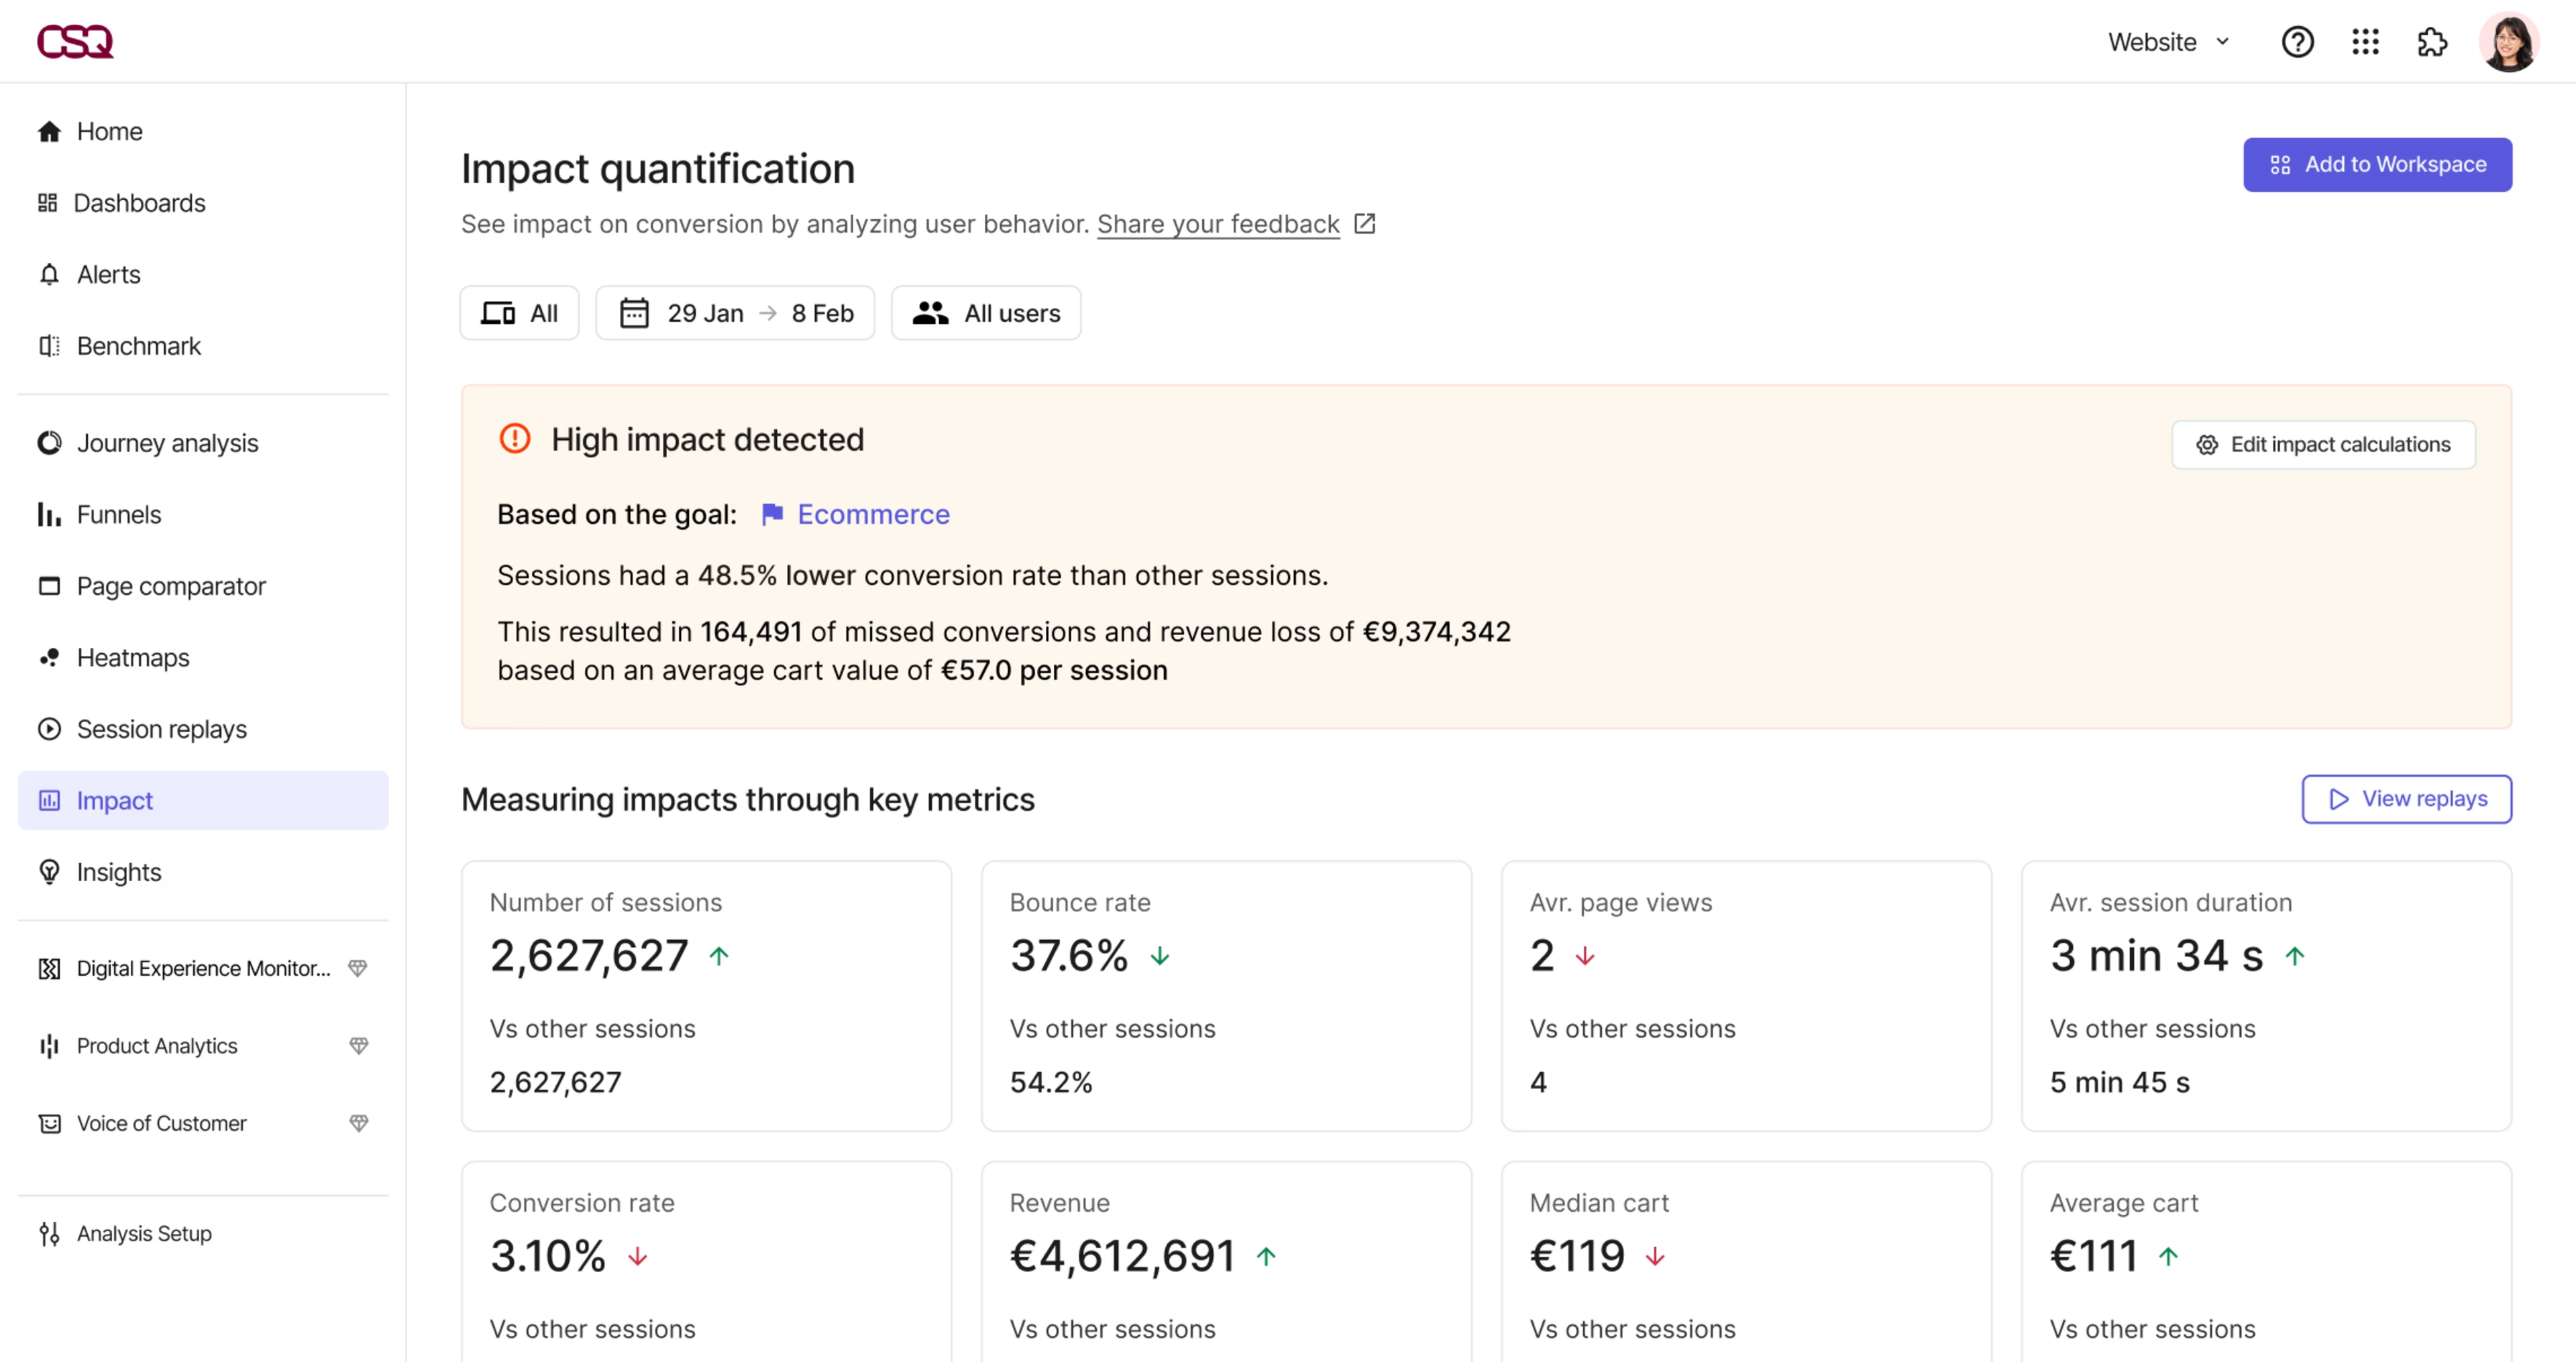
Use Contentsquare’s Impact Quantification to see the impact of any error on revenue and conversions
3. Fixing bugs does not automatically fix experiences
Dynatrace helps you spot technical issues like errors and slowdowns. But it doesn’t always explain what users were trying to do when things went wrong, or why they dropped off when everything looked fine on the backend. Many frustrating experiences never trigger a clear error, which means they often go unnoticed and unresolved.
If you integrate Dynatrace with Contentsquare, you’ll get better tools to understand user intent and friction, like Journey Analysis, Heatmaps, and automatic Frustration Scoring to pinpoint which parts of the experience are underperforming, and why.
By switching the focus from fixing bugs to fixing experiences, you reduce silent drop-offs, improve key flows, and drive measurable impact across the entire journey.
Use Contentsquare to troubleshoot technical and non-technical issues
4. Siloed data slows down decisions
Dynatrace is designed for technical users. Most dashboards speak DevOps, not product or UX. That makes it hard for non-engineering teams to access the data they need (or even know an issue exists). As a result, decisions are delayed, and simple fixes get missed.
When you integrate Dynatrace with Contentsquare, everyone sees the same story. Every digital team can instantly understand how performance issues affect users and revenue, and anyone can take action without waiting on a dev team to translate the data.
5 best Dynatrace alternatives to optimize application and business performance
Most of the tools below are true Dynatrace competitors. They monitor infrastructure, track system health, and help engineers resolve backend issues fast.
Our #1 pick, Contentsquare (yes, that’s us 👋), fills in the gaps Dynatrace leaves out. We connect performance issues to real user behavior, disrupted journeys, and lost revenue so you can prioritize fixes that have the biggest business impact.
That’s because we know that while finding errors is important, knowing which ones cost you customers is what drives growth.
Platform | Best for | Strengths | Limitations |
|---|---|---|---|
Dynatrace | DevOps teams needing deep observability across systems | Full-stack APM, AI root cause analysis, infrastructure and cloud monitoring | Complex pricing, technical dashboards, limited business and experience context |
Contentsquare | Digital teams optimizing across product, web, and mobile journeys | Autocaptures technical and experience issues, quantifies revenue impact of errors, AI analysis, visual tools for all teams | Works best when paired with an APM |
Datadog | DevOps and platform teams managing distributed systems | Infrastructure monitoring, real-time alerts, anomaly detection | Limited experience insights, no business prioritization |
New Relic | Engineering teams in modern cloud environments | App and security monitoring, intelligent alerts
| Shallow RUM, not built for non-technical users |
Splunk AppDynamics | IT and enterprise teams using the Splunk ecosystem | Combines application and business metrics | Technical dashboards, minimal experience data |
Sentry | Engineering teams | Error tracking, stack traces, session replays | Limited experience insights and business context |
1. Contentsquare
What it is Contentsquare is an all-in-one experience intelligence platform that combines experience monitoring, analytics, Voice of Customer (VoC), and revenue impact quantification.
Who it’s best for Any digital team that cares about how errors affect real users, journeys, and conversions.
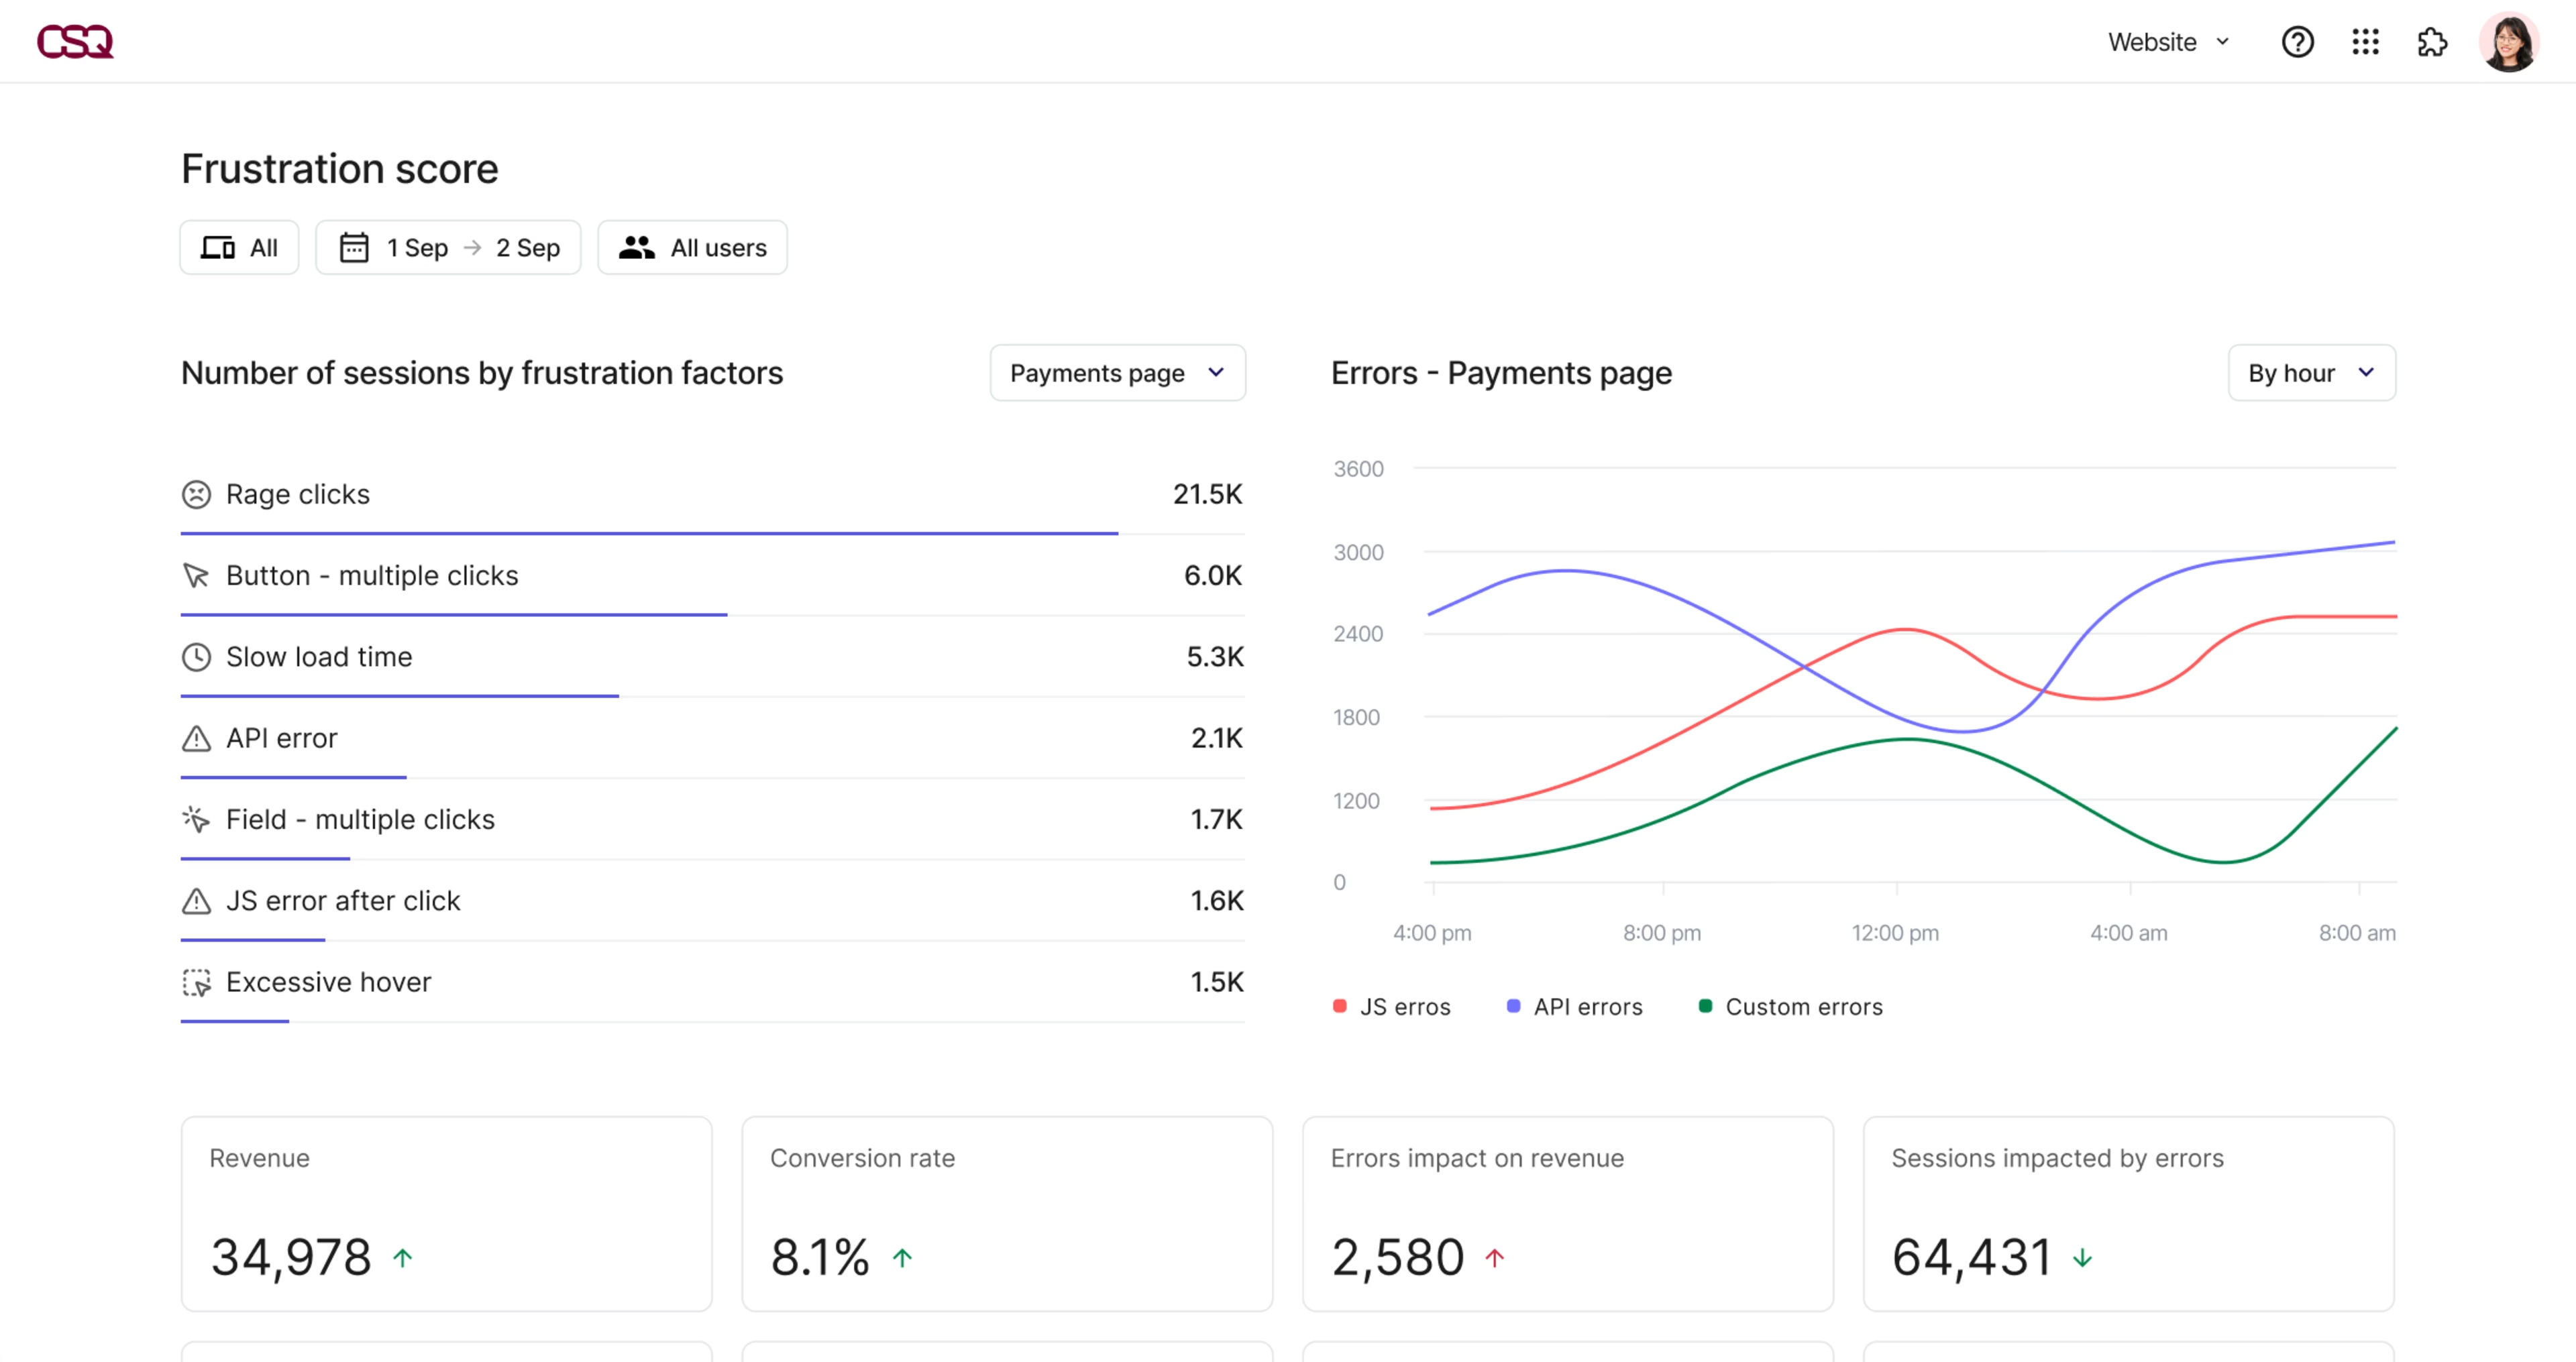
![[Visual] Error analysis](http://images.ctfassets.net/gwbpo1m641r7/6ELBPV051gA5ePLDZOiFEG/8352c504a71e140b84d4b0587b2c446c/eyJwYXRoIjoiY29udGVudHNxdWFyZVwvZmlsZVwvZHVGZlF4bWVzMjU0WGhkNXExOXcucG5nIn0_contentsquare_-5dJe5Xqp6vEwH1Gl8wqmZQXmHHT4auNG_.png?w=3840&q=100&fit=fill&fm=avif)
Monitor and prioritize errors, no technical knowledge required
What it does
Combines autocaptured Experience Analytics (including Heatmaps, Journey Analysis) with Product Analytics, and Voice of Customer to give you a complete picture of user behavior and friction across web and mobile
Pairs Experience Monitoring (including Error and Speed Analysis) with Frustration Score and Session Replay to find and fix issues fast
Quantifies the business impact of every bug or behavior trend to prioritize the right fixes
Pushes real-time error and friction alerts into the tools you already use, like Slack, Teams, and Jira
Captures mobile app interactions and issues so you can troubleshoot and optimize every step of the mobile experience
Makes insights actionable for every team through intuitive visual dashboards, AI alerts and recommendations
Integrates with Dynatrace, Datadog, Blue Triangle, AppDynamics, and other APM tools to connect technical issue data with real user behavior, journey friction, and business impact
![[visual] Trackr errors, performance, and experience in one platform](http://images.ctfassets.net/gwbpo1m641r7/5kij4TrV5pm5szmdUXmsFV/aa2461e9d49a006265c63e335acd8e15/Contentsquare-speed-analysis.jpeg?w=3840&q=100&fit=fill&fm=avif)
Trackr errors, performance, and experience in one platform
Why we’re better than Dynatrace
Since Contentsquare autocaptures every interaction automatically (we call it Smart Capture), it surfaces both technical issues (like slow API calls or JavaScript crashes) and non-technical friction (like hesitation, rage clicks, or unresponsive elements) across your sites and apps. Every team gets complete visibility into what’s broken. AI-powered alerts flag critical issues as they happen and Impact Quantification makes it clear what needs fixing first.
And because Contentsquare integrates with your APM of choice, you can use it to bridge the gap between system health and user experience and align everyone on what’s broken, why it matters, and what to fix first.
2. Datadog
What it is
Datadog is an integrated monitoring and security platform focused on technical issue detection, analysis, and resolution across applications, infrastructure, and cloud environments.
Who it’s best for
DevOps, SRE, and platform teams managing complex distributed systems.
What it does
End-to-end observability into application health and performance
Detects, prioritizes, and responds to security threats in real-time
Software tools to build, test, secure and ship code
AI-powered root cause analysis and anomaly detection
+850 built-in integrations, including Contentsquare
Why it’s not enough
Datadog tells you what broke and where, but not how it impacted user experience or business metrics. There’s limited visibility into journey friction and behavior patterns (especially when no backend alert is triggered) and no easy way to prioritize fixes based on lost conversions or revenue.
That said, you can overcome these limitations if you integrate Datadog with Contentsquare.
3. New Relic
What it is New Relic is a full-stack observability platform that brings together application, security, and infrastructure monitoring.
Who it’s best for Engineering, SRE, and DevOps teams looking for a flexible toolset that fits easily into modern cloud ecosystems and developer workflows.
What it does
Tracks system performance across applications, servers, containers, and frontend experiences using unified telemetry
Interactive application security testing to find, fix, and verify high-risk vulnerabilities
Intelligent alerts for critical performance issues
Integrates with +780 tools and platforms, including Contentsquare
Why it’s not enough As with Dynatrace and Datadog, while New Relic gives a deep technical view of system health and performance, it’s light on experience monitoring. RUM features don’t go deep enough (and aren’t user-friendly enough) to give digital teams insight into non-technical issues and how they’re impacting performance.
However, you can overcome these limitations by integrating New Relic with Contentsquare, as one of our customers, DFS, has showed us.
🎥 See it in action: when the UK’s largest sofa retailer and manufacturer, DFS, replatformed, they used Contentsquare Experience Monitoring alongside New Relic to identify errors, quantify their impact, and prioritize fixes.
The team identified and quickly fixed 9 API errors, helping deliver a -20% reduction in load time and a -9% reduction in bounce rate sitewide.
Read (and watch) the full story here
4. Splunk AppDynamics
What it is Splunk AppDynamics (now a Cisco company) is a full-stack observability platform that combines application and business performance monitoring.
Who it’s best for IT, DevOps, and reliability teams at large organizations that are already using the Splunk platform and want to combine business metrics with application monitoring.
What it does
Identifies SAP, network, and application issues in real-time
Secures applications by detecting vulnerabilities and blocking attacks
Adds business metrics to application logs and events
AI root cause analysis and issue detection
Why it’s not enough Splunk AppDynamics gives you a strong technical view of system performance and it’s more business-focused than most Dynatrace competitors. But it still suffers from the same issues: highly technical dashboards make it different for cross-functional teams to self-serve insights, and limited experience insights lead to an overreliance on bugs instead of overall UX improvements.
5. Sentry
What it is Sentry is a popular APM and error tracking tool.
Who it’s best for Engineering teams who want detailed stack traces, performance insights, and direct integration with their CI/CD workflows.
What it does
Automated error monitoring with custom alerts
End-to-end tracing to pinpoint where issues started
Session replay to get context and view rage clicks and dead clicks
Code coverage (formerly Codecov) to test source code
Why it’s not enough Sentry has technical monitoring covered, but its experience monitoring begins and ends with session replays. It suffers from the same problem as Dynatrace, Datadog and other APMs: it’s built for developers, not digital teams. Replays help engineers understand how to deploy a fix, but they won’t show patterns of friction, surface behavioral signals, or quantify business impact.
For that, you’ll need Experience Analytics. We have an integration (currently in beta) so you can investigate Sentry sessions in Contentsquare.
Get more out of any APM with Contentsquare
Even the best Dynatrace alternatives still have the same problems: they’re primarily built for engineers, they miss non-technical issues, and don’t make it easy to prioritize what to fix based on actual business value.
By integrating any Dynatrace competitor with Contentsquare, you get fewer silos, faster fixes, and a clearer sense of what matters most to your users and your business.
Here’s how we do it.
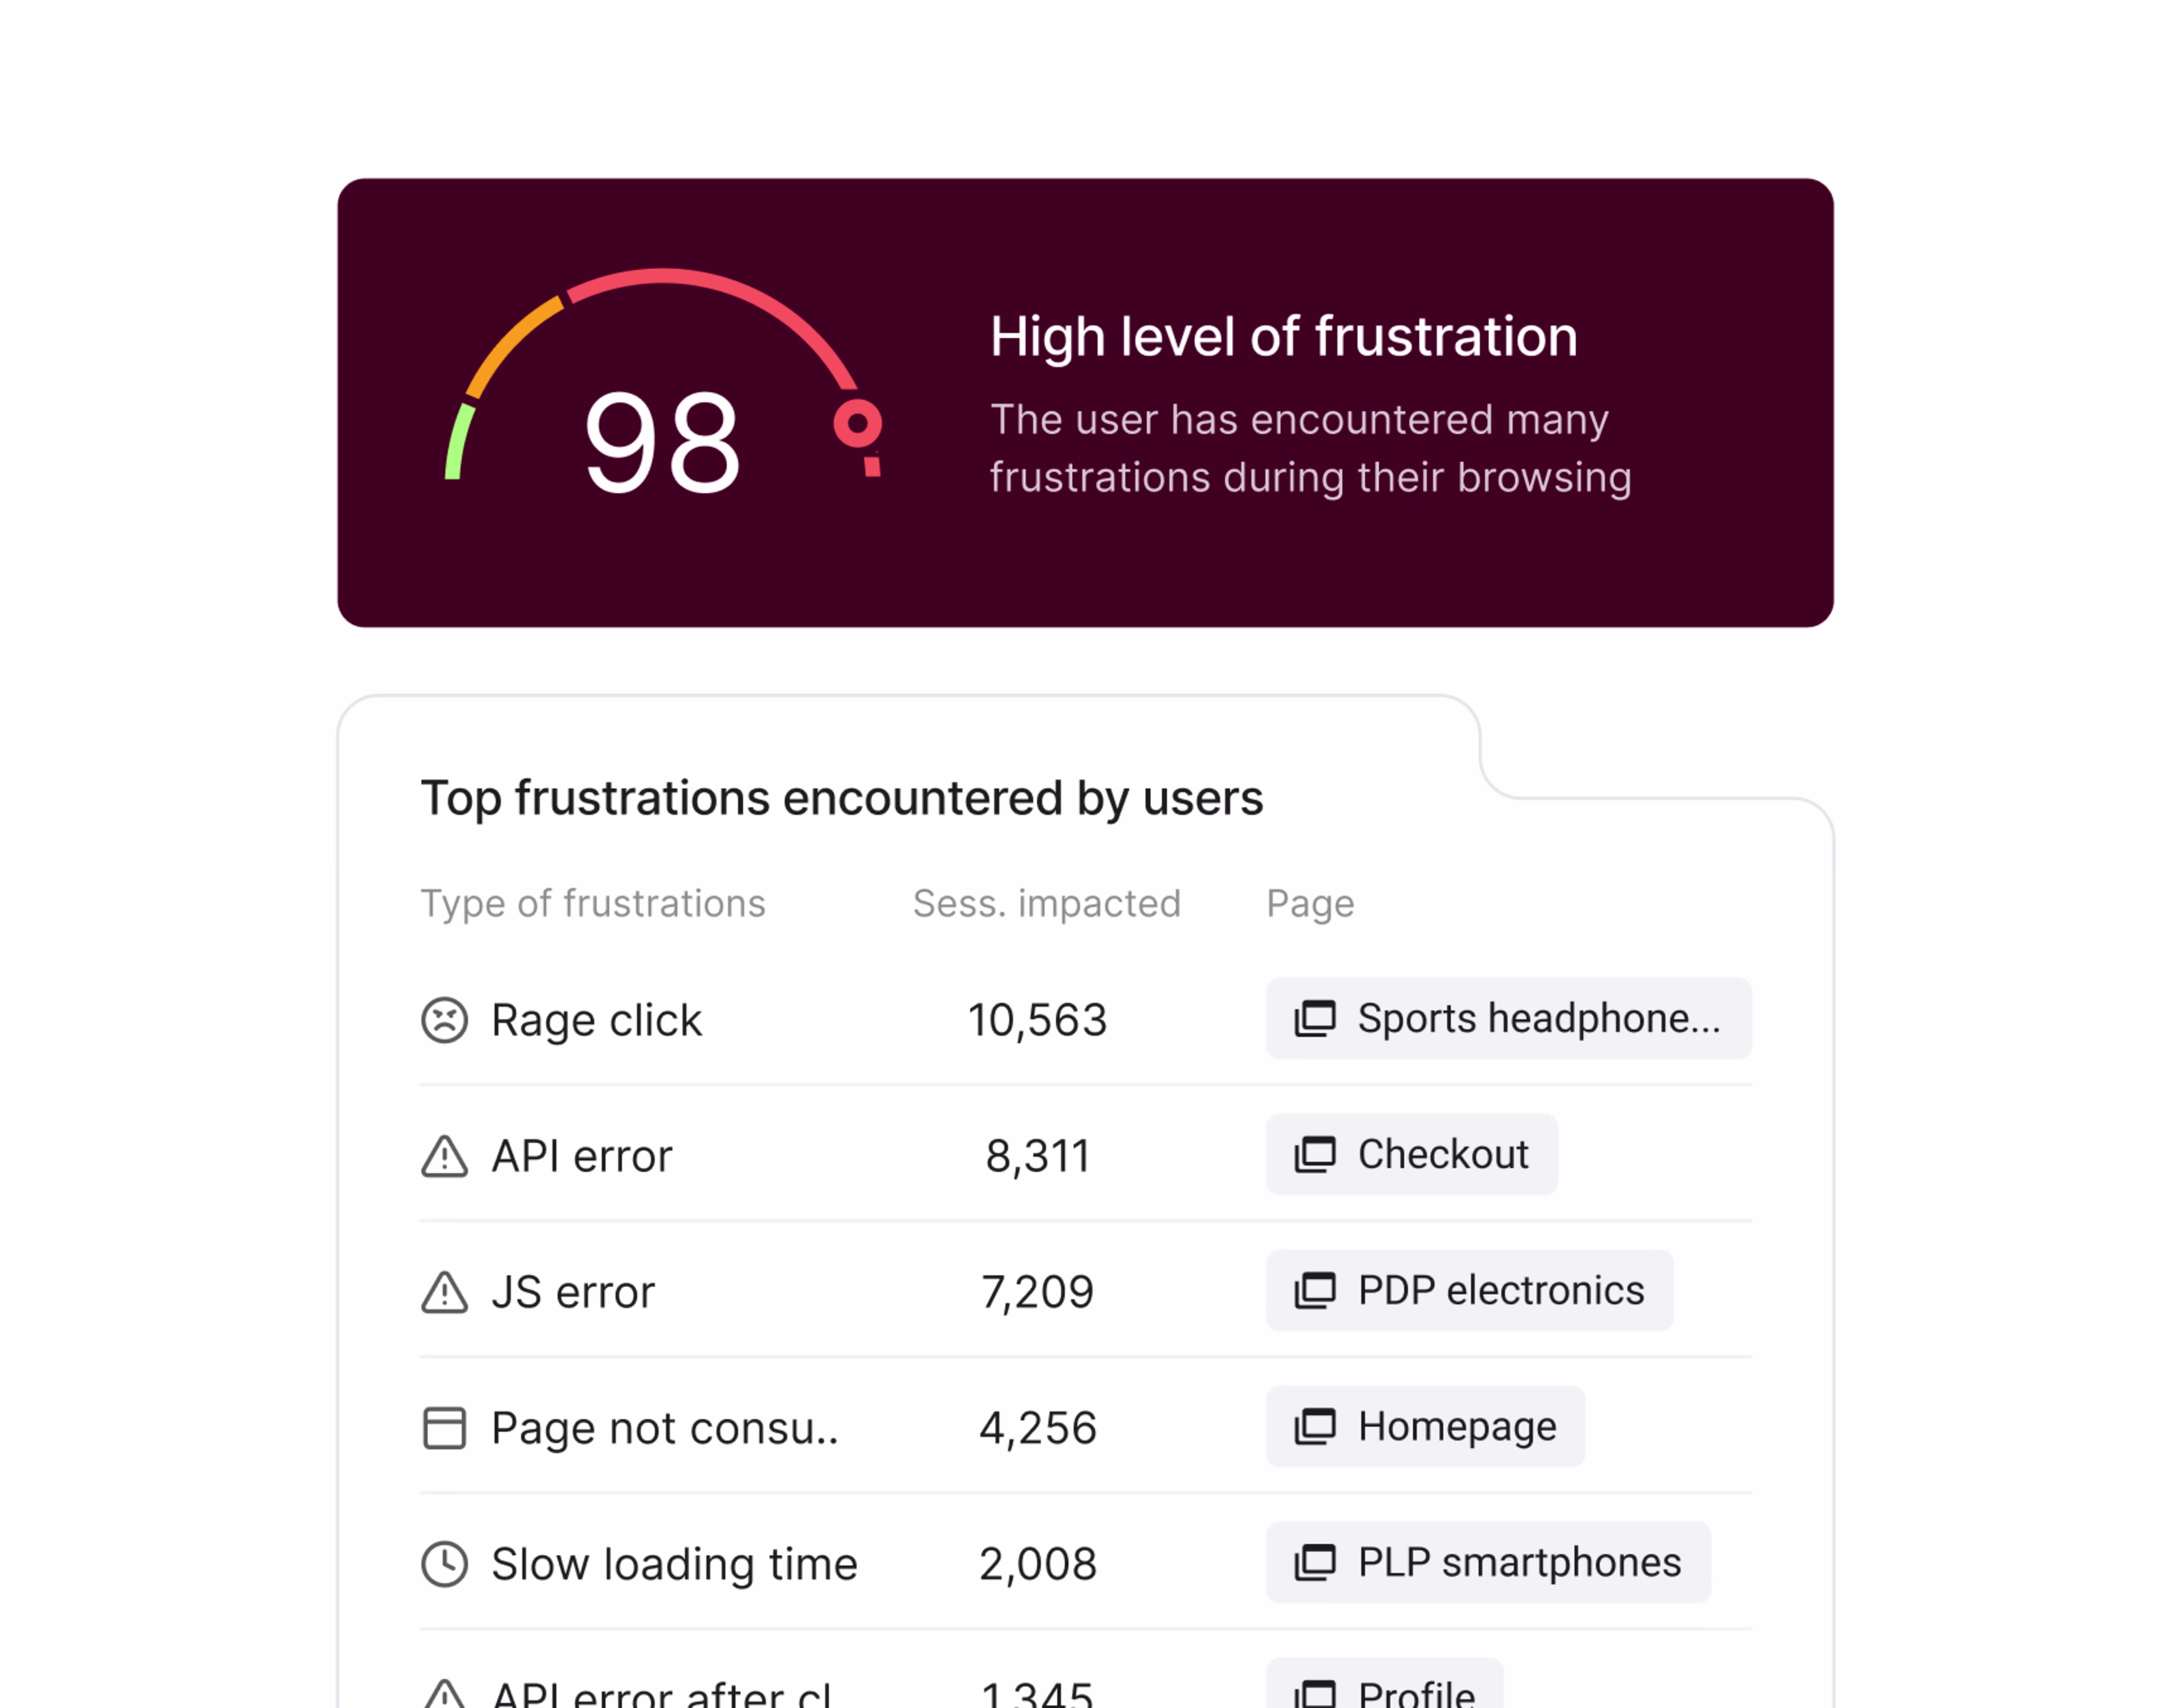
1. Monitor technical issues and user frustration in one place
Customers experience frustration in more than 1 in 3 visits. But many frustration signals like hesitation or confusion don’t trigger a JavaScript error or an alert in your APM. Contentsquare gives you insight into every cause of customer frustration:
Use Journey Analysis to spot where users are dropping off, looping, or getting stuck in high-value flows
Connect Voice of Customer with behavior to let users tell you what’s wrong and identify patterns behind feedback at scale
Monitor Frustration Score to track signals like rage clicks, repeated interactions, and inactivity
Use Error Analysis with 1-click summaries to surface technical and non-technical errors
Use Speed Analysis to monitor page load times with RUM and synthetic monitoring
Find root causes in Session Replays, saving time with AI summaries and skipping straight to relevant sections
Quickly find and fix technical and non-technical issues in one platform
2. Prioritize fixes by revenue impact
There’s no point collecting a massive to-do list of fixes if you don’t know what to work on first. Most APMs tell you how many users were affected. Contentsquare tells you exactly what errors are costing you:
Click ‘quantify’ when you’re viewing a heatmap, session replay, or journey to see how much an issue or behavior is impacting revenue or conversions
View top errors by missed opportunity in your error dashboard
Get automatic alerts for the most critical issues so you never miss an impactful fix
![[Product screenshot] Error Analysis - Main page (revamp)](http://images.ctfassets.net/gwbpo1m641r7/7LTZ2NADQfQ9SR2Im8yewV/c67a392c9d2a7d760747732576f7a7b6/-Product_screenshot-_Error_Analysis_-_Main_page__revamp_.png?w=3840&q=100&fit=fill&fm=avif)
Rapidly track down the the errors that are most impacting business metrics
3. Leverage error data across the org
Data is only useful if everyone can act on it. Most APMs keep experience insights locked in technical dashboards.
Contentsquare makes error data accessible and actionable across the org:
Share AI-generated Error Summaries to speed up investigation and resolution
Add comments directly to Session Replays so everyone’s aligned on what went wrong and what to fix
Route critical errors into Slack, Teams, or Jira to bring issues into your team's daily workflow
Let non-technical teams explore errors visually, using Heatmaps, Journeys, Feedback, and Replays instead of raw logs
Link directly from Contentsquare to Dynatrace or your APM of choice to drill into root cause
![[visual] AI error summaries let you quicklyspot what's wrong and why it matters](http://images.ctfassets.net/gwbpo1m641r7/53GAOx8Nm3Q1wf17OSt8Q5/98a2dca7fdfbd95577bb64e94b7b067b/Contentsquare-AI-error-summaries.png?w=3840&q=100&fit=fill&fm=avif)
AI error summaries let you quicklyspot what's wrong and why it matters
Final take: swapping APMs won’t close the experience gap
Switching from Dynatrace to another APM might get you a better UI or different pricing model, but it won’t solve the bigger problem.
Tools like Dynatrace, Datadog, and New Relic are all built to monitor systems, not experiences. They surface alerts and errors, but they don’t show you how those issues impacted real users, disrupted journeys, or cost you revenue.
Contentsquare fills that gap. We give every team a shared understanding of what broke, why it matters, and how to fix it—based on real user behavior and business impact.
Instead of adding more dashboards and noise, you get prioritized fixes, faster resolution, and full alignment across teams on what matters most.
So don’t replace Dynatrace with another APM: use Contentsquare to make your APM actionable.
That’s why businesses using Contentsquare see a 602% ROI and recover over $3.2 million in revenue by fixing friction in the digital journey. Come and see it for yourself by requesting a demo or taking a product tour.
Dynatrace alternatives FAQs
Top Dynatrace competitors include:
New Relic
Splunk AppDynamics
Sentry
![[Visual] Contentsquare's Content Team](http://images.ctfassets.net/gwbpo1m641r7/3IVEUbRzFIoC9mf5EJ2qHY/f25ccd2131dfd63f5c63b5b92cc4ba20/Copy_of_Copy_of_BLOG-icp-8117438.jpeg?w=1920&q=100&fit=fill&fm=avif)
We’re an international team of content experts and writers with a passion for all things customer experience (CX). From best practices to the hottest trends in digital, we’ve got it covered. Explore our guides to learn everything you need to know to create experiences that your customers will love. Happy reading!