It looks like 2024 could be another challenging year for digital teams—though it will be less challenging for those who read on. We promise.
New update: What do users want from websites in 2025? Key stats in video
Teams are being asked to drive KPIs by providing slick, innovative digital experiences that cater to ever-rising customer expectations.
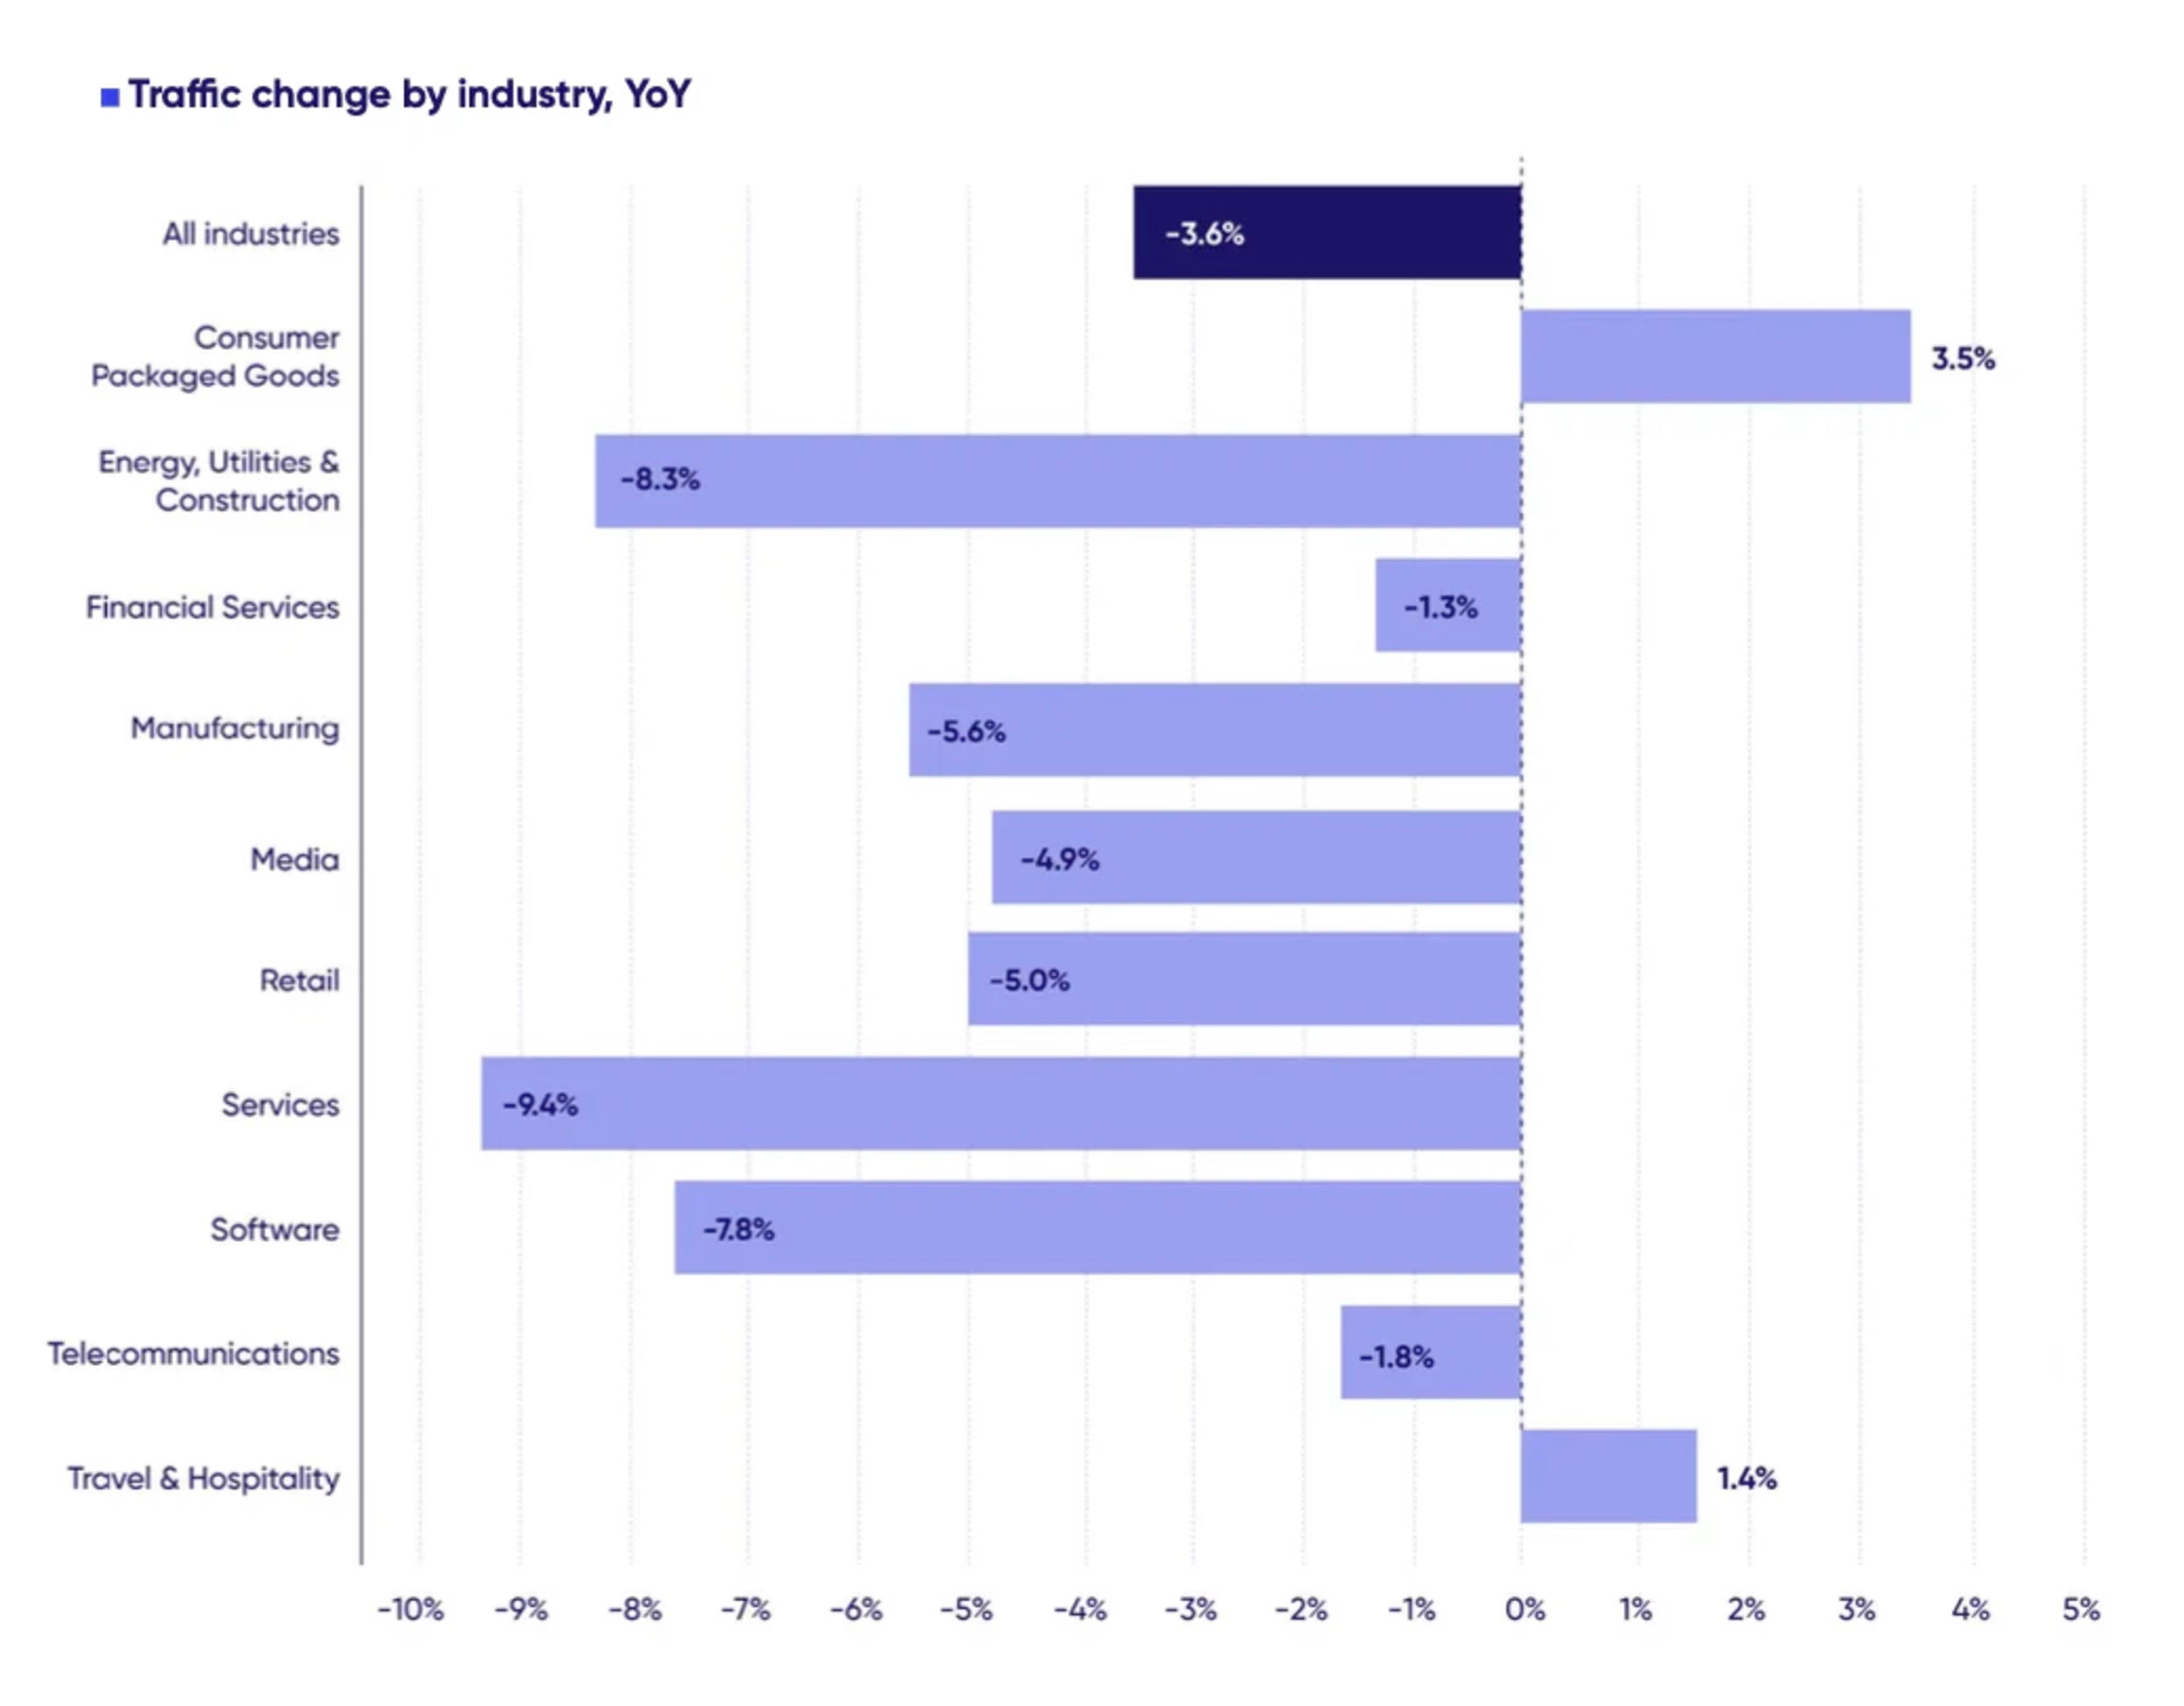
At the same time, they’re expected to work within the tighter budgets demanded in a time of economic uncertainty—a particularly big ask, considering that traffic is decreasing by -3.6% volume and visits have risen in cost by +9.4%.
Now more than ever, digital leaders need to know just how competitive their digital customer experience is, and precisely what they need to focus on to deliver an excellent experience with maximum efficiency.
Well, if you’re a digital leader or team member and still reading, we have great news (as promised): The 2024 Digital Experience Benchmark Report and Interactive Explorer is here to give you the insight, focus and strategic direction you need to succeed this year.
We’ve analyzed user behavior data throughout 2023 to deliver an unparalleled analysis of the state of the digital customer experience, drawing on our biggest ever dataset, spanning >43 billion sessions, >200 billion page views, 3,590 websites, 30 countries and 10 industries.
The report is packed with dynamite data around global trends in traffic, engagement and conversion for you to place your brand’s performance in a macro context—and benchmark it against your industry peers.
And it’s stuffed with strategies for optimizing digital customer experience and elevating your customer journeys, creating happier customers and driving more engagement, retention, conversion and growth.
That sounds pretty irresistible to us. However, if you need a little more persuading (or are just interested in previewing some of the metrics, trends and insights inside), keep reading…
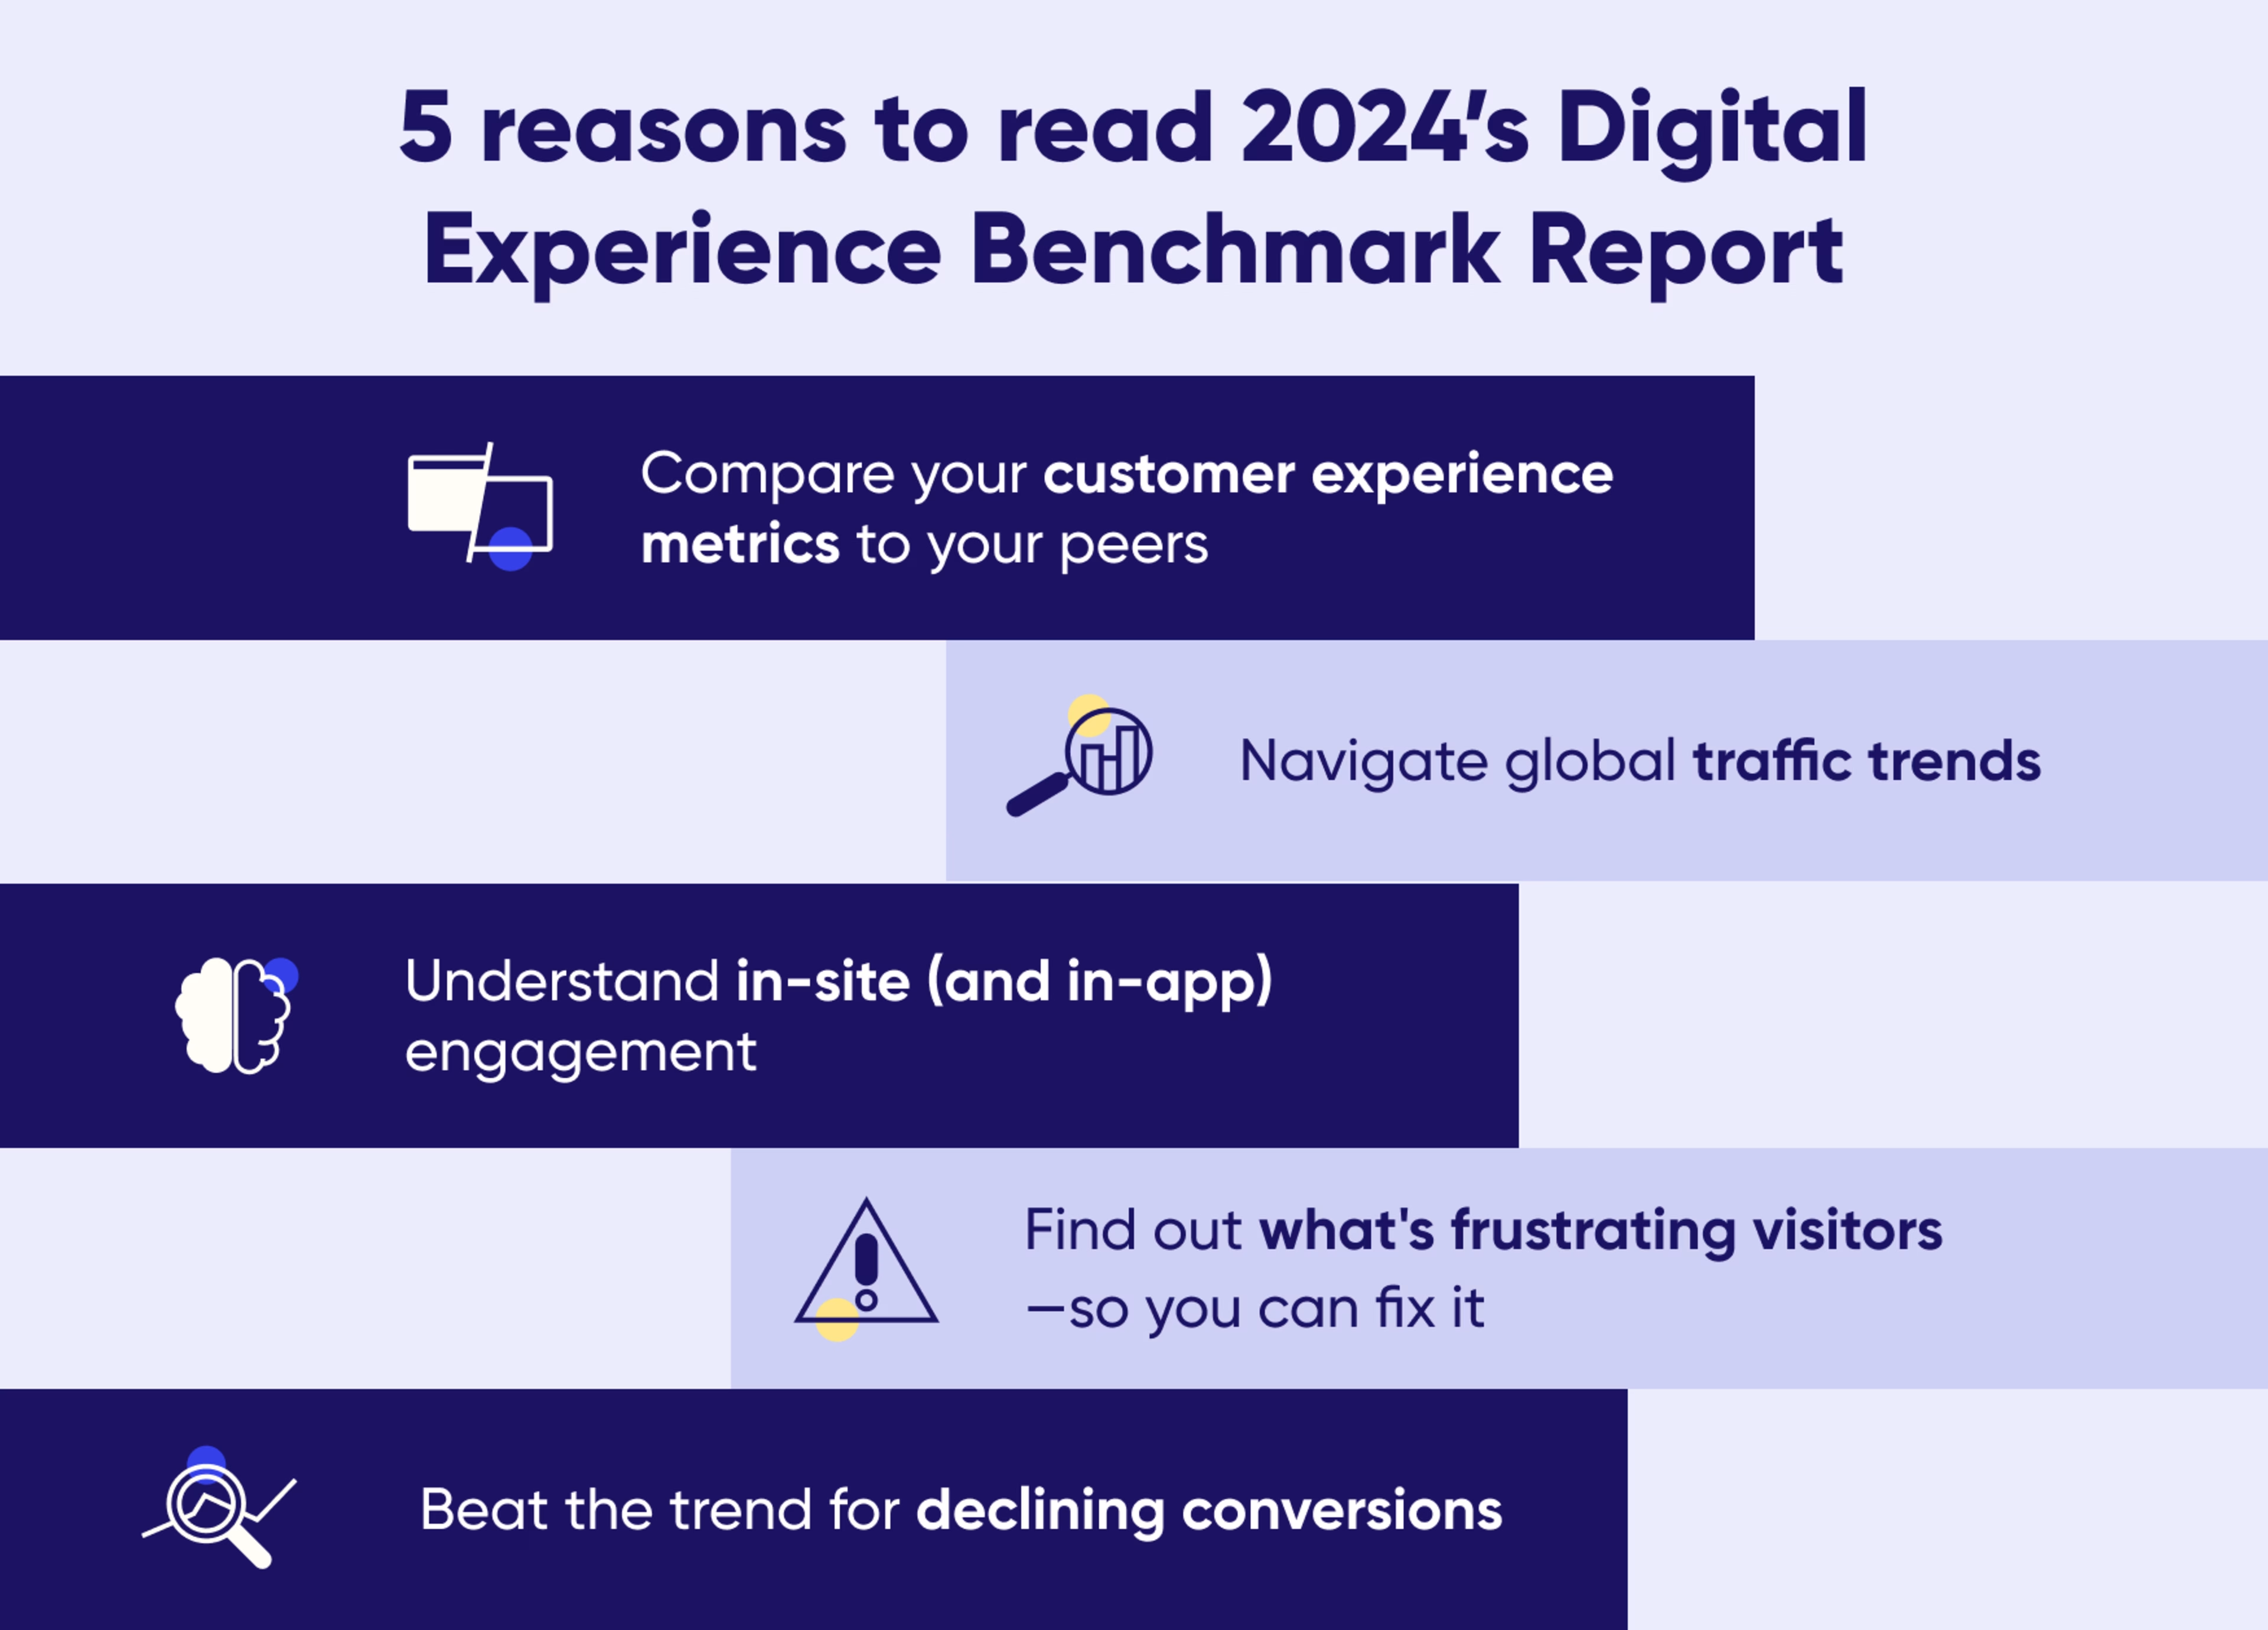
1. Measure your customer experience against your industry peers
This year we’ve analyzed no less than ten industries so you can directly compare a host of your experience metrics to your competitors in:
Consumer Packaged Goods (All new for 2024)
Energy, Utilities & Construction
Financial Services
Manufacturing
Media
Retail
Services
Software
Travel & Hospitality
Telecommunications
The Digital Experience Benchmark Report shares insights into why some industries avoided the trends we saw affecting all (or almost all) the others, and gives industry-specific tips for building a benchmark-beating experience in 2024.
What’s more, register to access the Report and you’ll also be able to access our Interactive Explorer, a page of interactive (and damn good looking, if we say so ourselves) visualizations of key insights—which you can filter by industry for an at-a-glance understanding of how you measure up to the competition.
2. Find out why traffic is getting harder (and costlier) to attract
We break traffic down every which way in our report—by channel source, by device type and by new vs. returning. However, the biggest headline relating to traffic this year is about volume.
In 2023, 55% of all sites saw that volume go down, as traffic declined -3.6% year-on-year, with 55% of all sites seeing less traffic than in 2022.
At the same time, we saw a 5.6% shift away from organic to paid traffic. Paid drove 1 in 3 (33.8%) of visits—and 40% of new visits—in 2023.
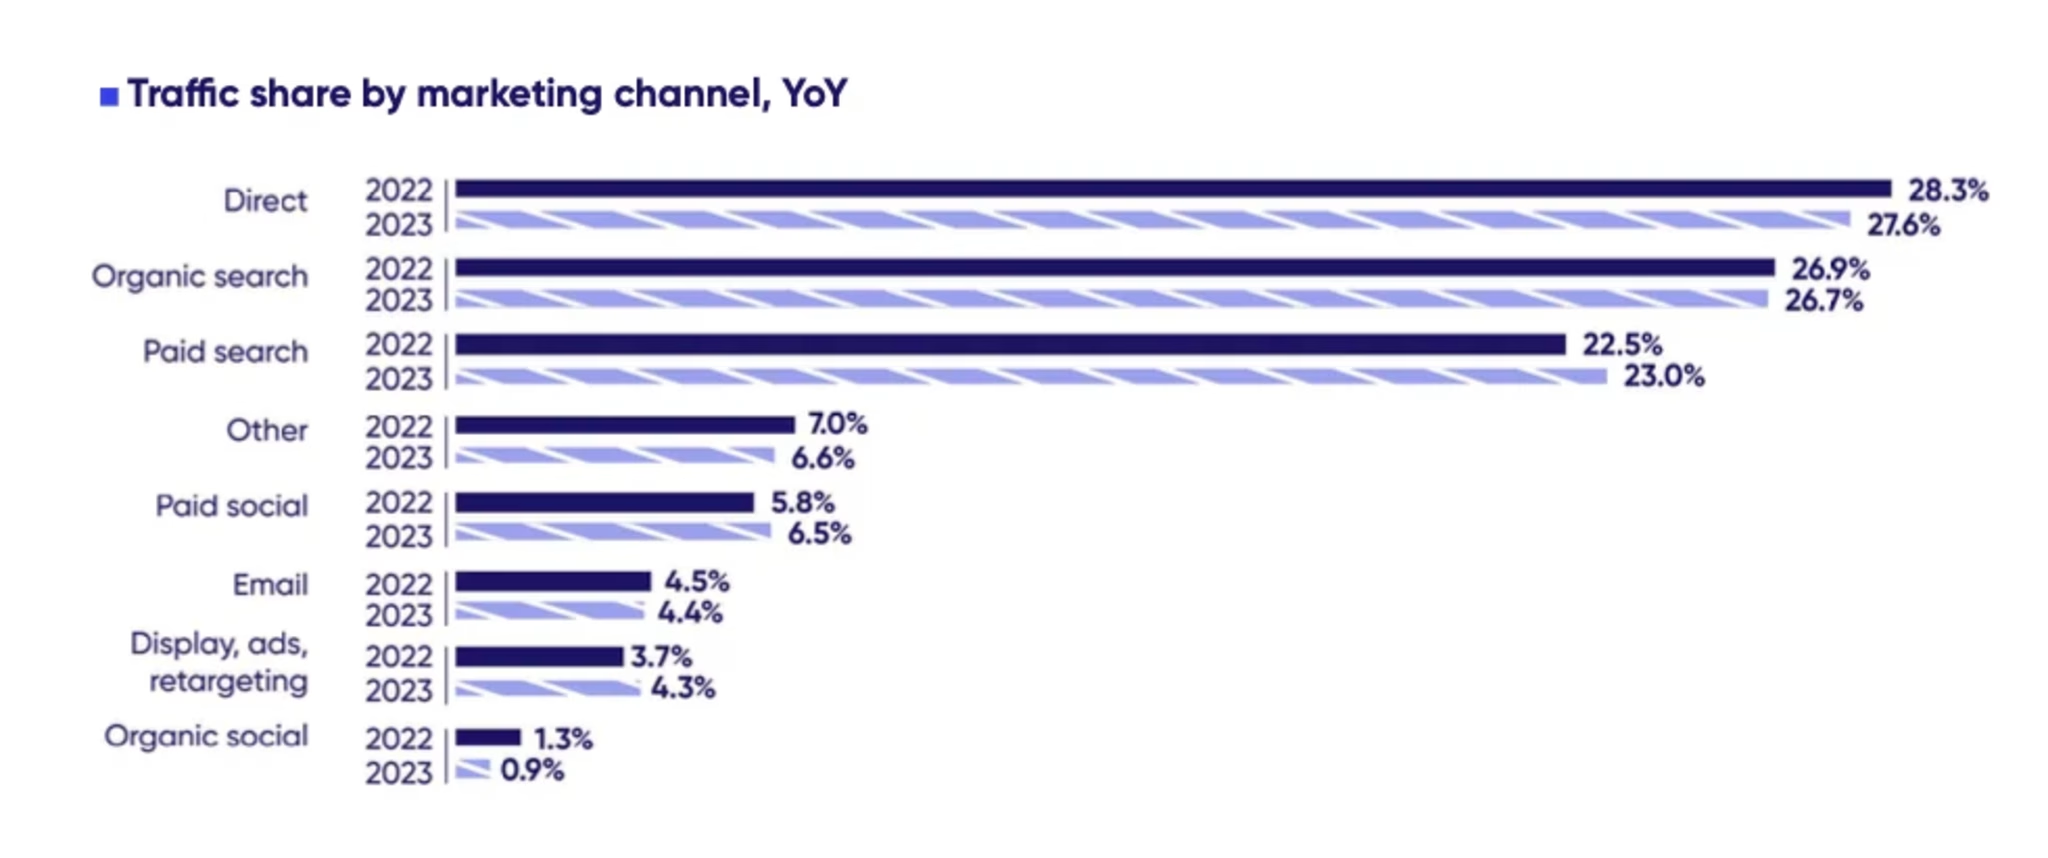
Paid’s growth is linked to the continuing growth of mobile traffic, which is twice as likely to be sourced from paid than desktop traffic.
The growth of paid presents problems for digital teams.
Firstly, it’s (naturally enough) costly—and getting costlier. Ad spend rose across critical acquisition channels like Google and Meta in 2023, and the decline in traffic plus the shift to paid meant the cost per visit was pushed up +9.4%. 1
Secondly, as we’ll see later, paid and mobile traffic can be harder to convert than desktop traffic.
Combined with the overall decline in traffic volume, paid traffic’s increasing importance means visits are more valuable than ever—and you have to take advantage of every visit to ensure you’re not throwing budget away.
To do that, you’ll need to provide visitors with a great digital experience. The 2024 Digital Experience Benchmarks will help you understand what a great experience looks like for your industry.
3. Understand in-site (and in-app) engagement
Whatever the industry, an outstanding digital experience is always two things: highly engaging and minimally frustrating—and both engagement and frustration are amply covered in the report.
Let’s start with engagement.
From the moment visitors first arrive on your site, you need to engage them with compelling content to have a hope of converting them. To measure engagement in the digital experience, we use consumption metrics.
Consumption measures the amount of content consumed during a session, including page views and time spent on-site.
Last year, we speculated that there may be a ‘consumption crisis’ brewing, as we saw several key consumption metrics fall, indicating that visitors were increasingly making shorter, shallower and harder-to-convert visits to websites.
But while consumption declined by -3% overall in 2023 a(and 58% of sites saw a drop), this was far from an across-the-board drop. In fact, half of the industries we analyzed saw consumption increase.
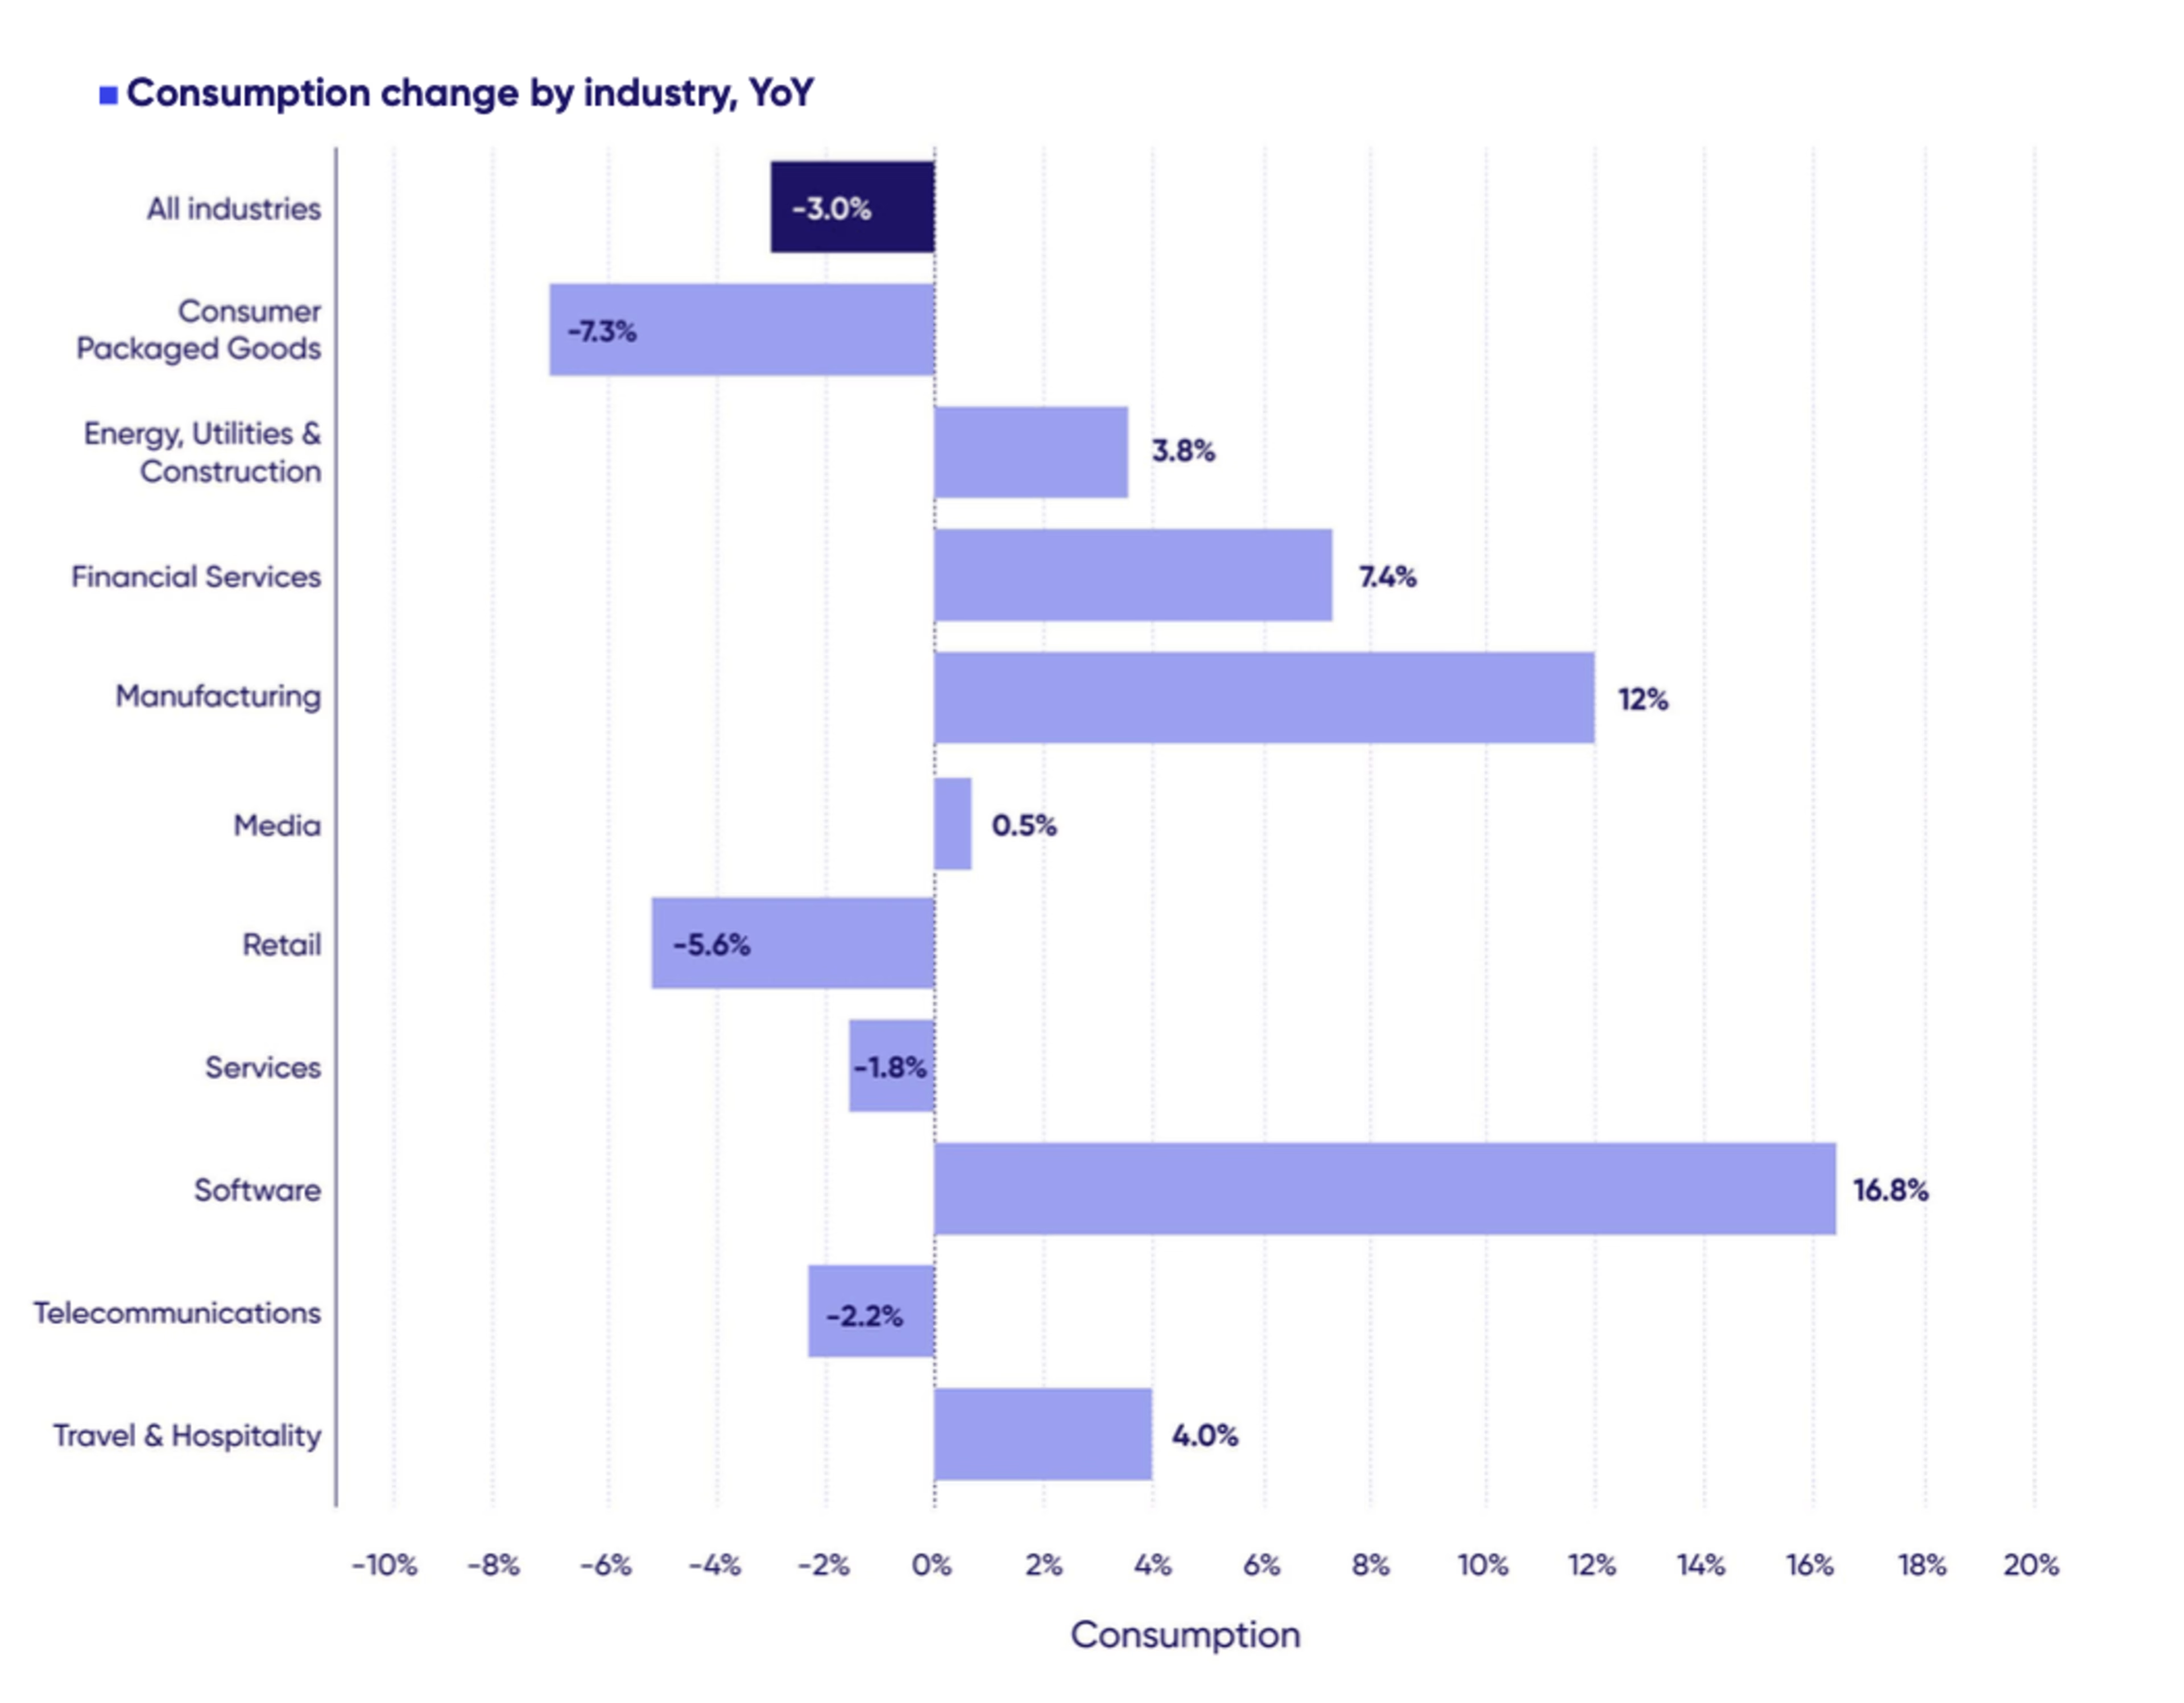
That’s great news—and we’d like to see every industry see increased consumption in 2024.
The 2024 Digital Experience Benchmark Report contains numerous tips and best practices for optimizing your journeys for consumption—breaking down, for example, which page types work best as landing pages from the point of view of encouraging deeper, more valuable sessions.
Every industry still has to work hard to encourage consumption—especially on mobile.
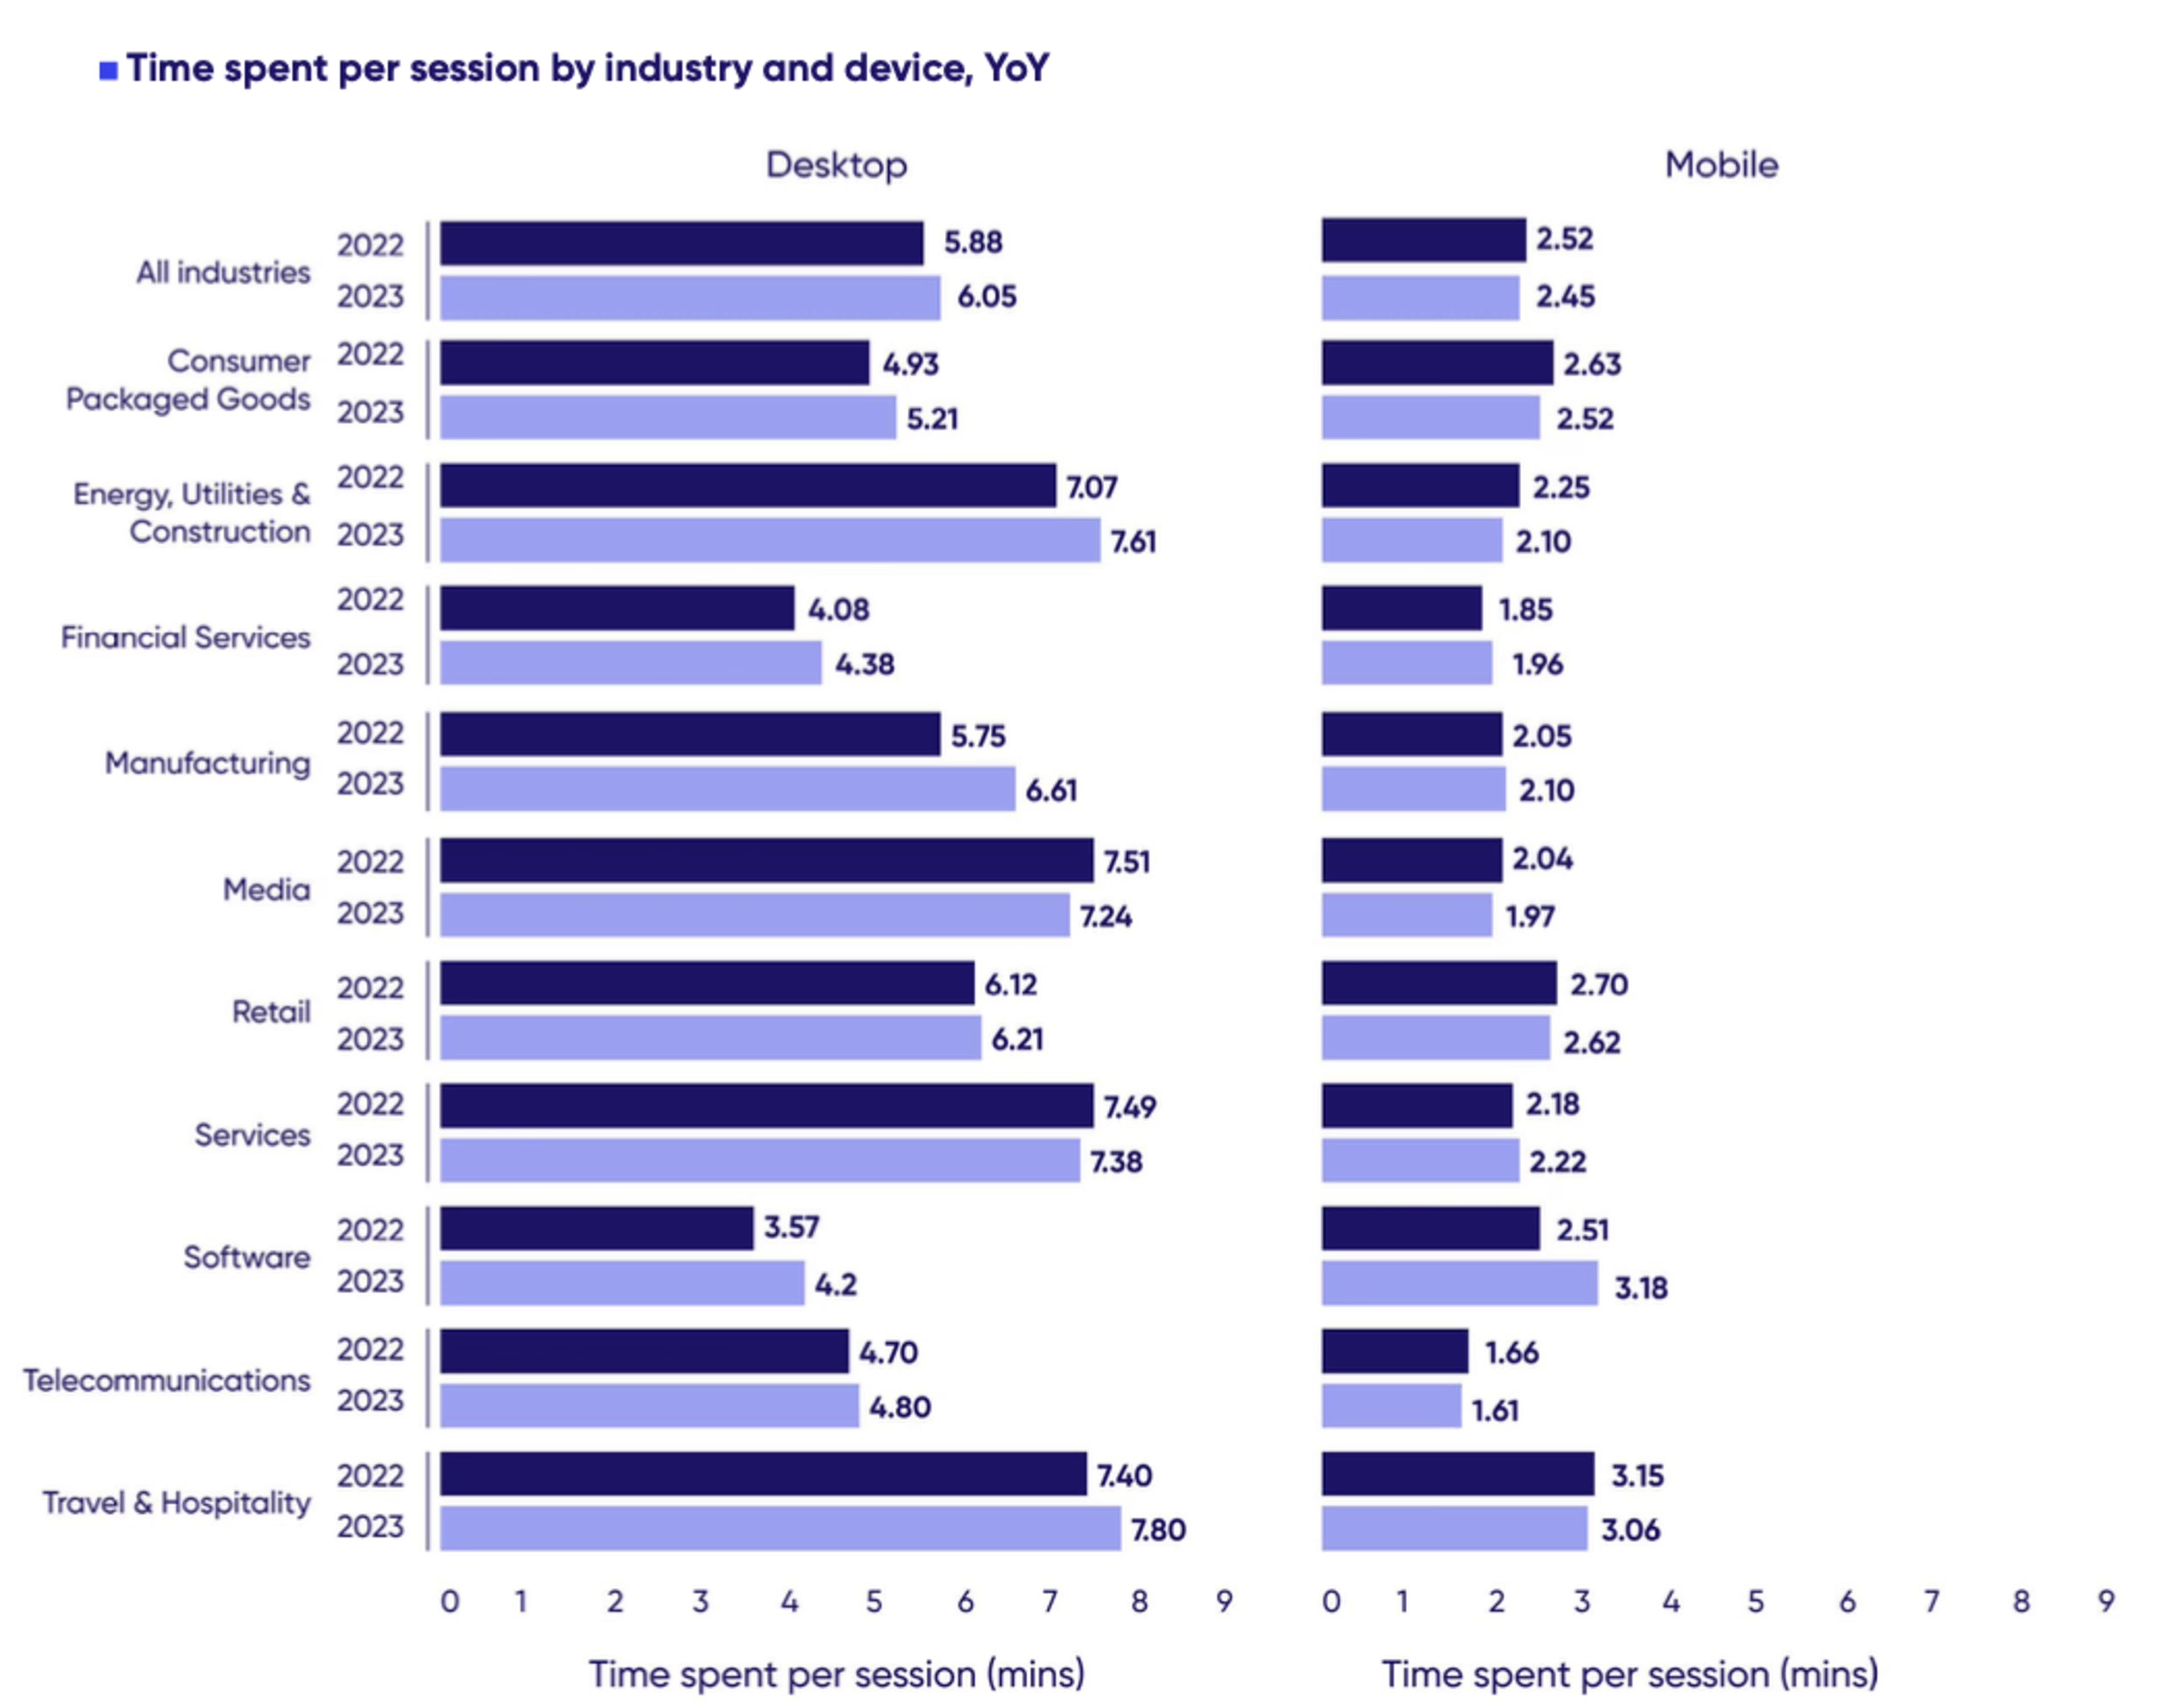
Mobile traffic, which now accounts for 69.7% of visits across all industries (and captures over 70% of traffic in several), continues to lag far behind desktop traffic in terms of pages viewed and time spent per session.
For many (though far from all) brands, one way to drive up consumption rates on mobile is to invest in a mobile app. This year’s Benchmark report is the first to feature analysis of app experiences—and shows that app users spend 64% more time in app than mobile web site visitors.
4. Find out what’s frustrating your users (so you can fix it)
One way in which brands can optimize experiences on both desktop and mobile is by removing points of friction and obstacles to conversion.
Friction in the digital experience causes frustration, which in turn can undermine visits and cause visitors to leave (and never come back).
In fact, in the report we’ve drawn on Google’s Core Web Vitals to calculate the potential impact of frustration, and found that it can reduce engagement—and therefore visit value—by 15%.
Frustration remains a problem for digital teams—it was up +3.9% in 2023, and impacted 2 in 5 (39.6%) of visits.
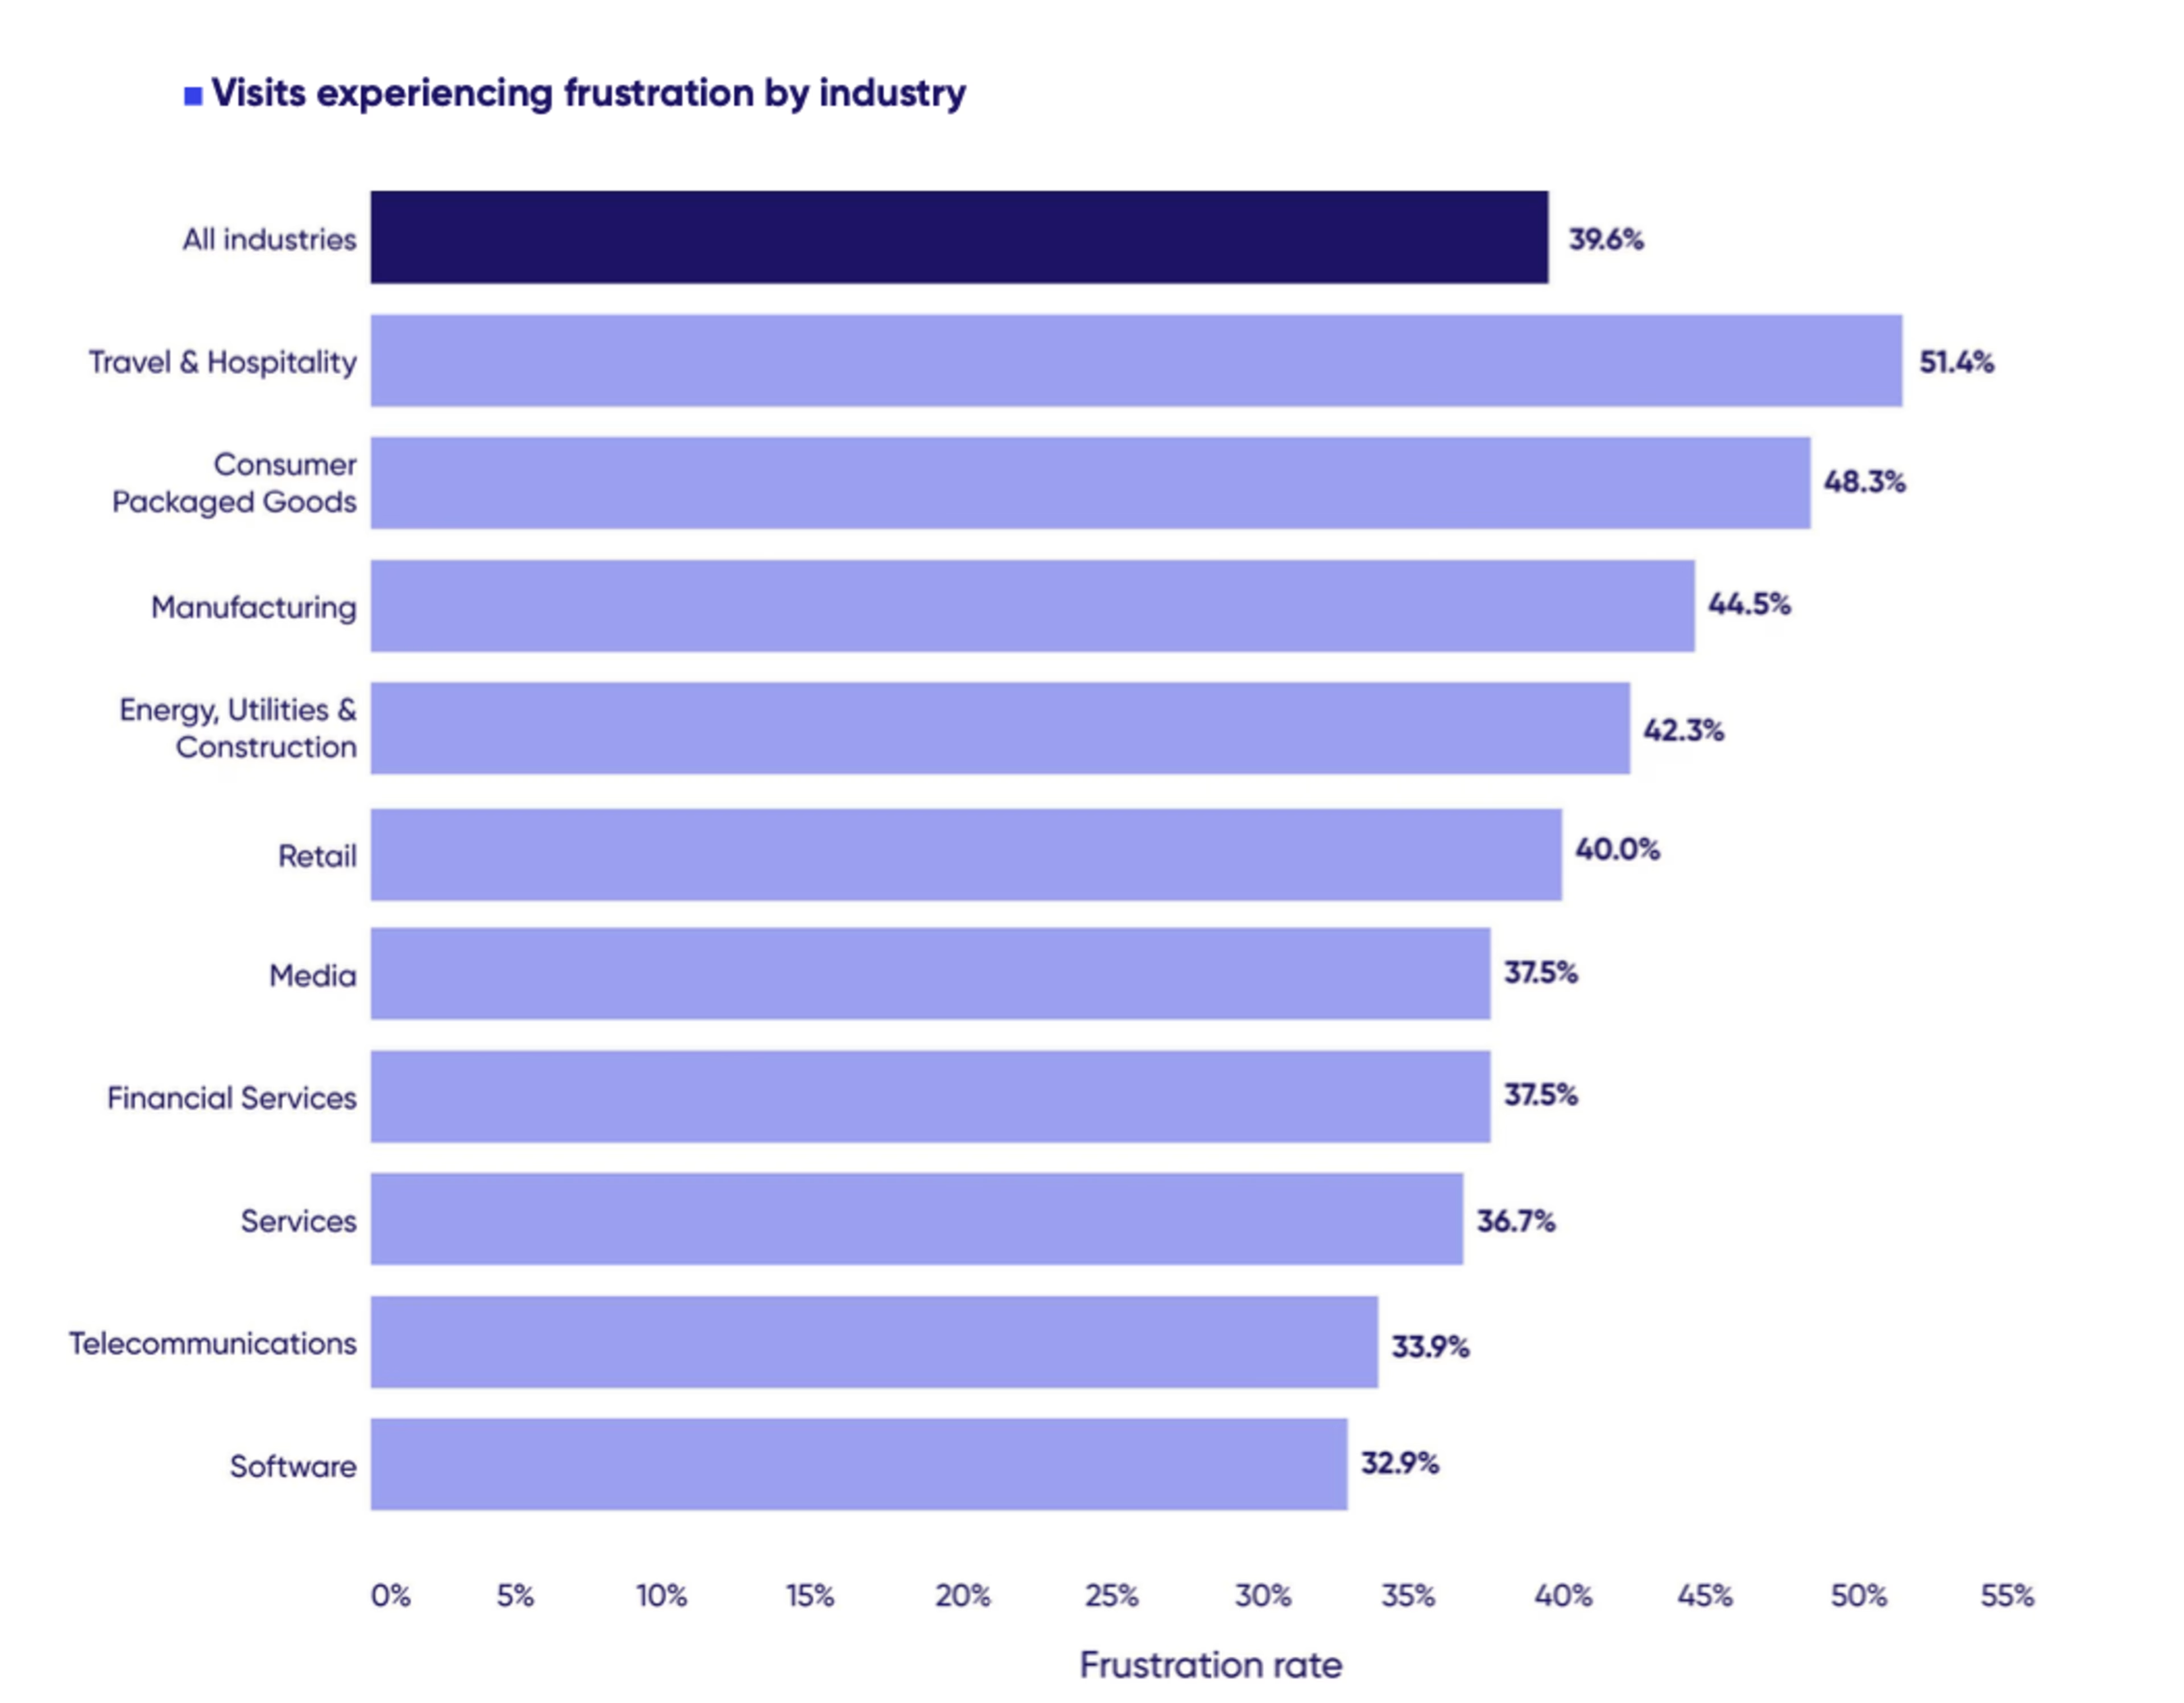
However, the good news is that several of the key frustration factors identified in last year’s report fell this year, suggesting that brands are making significant progress in the fight against frustration.
The Digital Experience Benchmarks will help you reduce frustration in the experience by helping you know your enemy, once again breaking down the most damaging ‘frustration factors’ that digital teams need to crack down on.
5. Beat the trend for declining conversions
Conversion rates dropped by -5.5% in 2023. And this makes sense, given the traffic trends identified in our analysis.
Firstly, there’s traffic’s shift towards paid sources—which are a mixed bag from a conversion perspective.
Paid search has one of the highest conversion rates of any marketing channel (2.55%). But Display, ads and retargeting and Paid social have among the lowest conversion rates—and among the highest bounce rates.
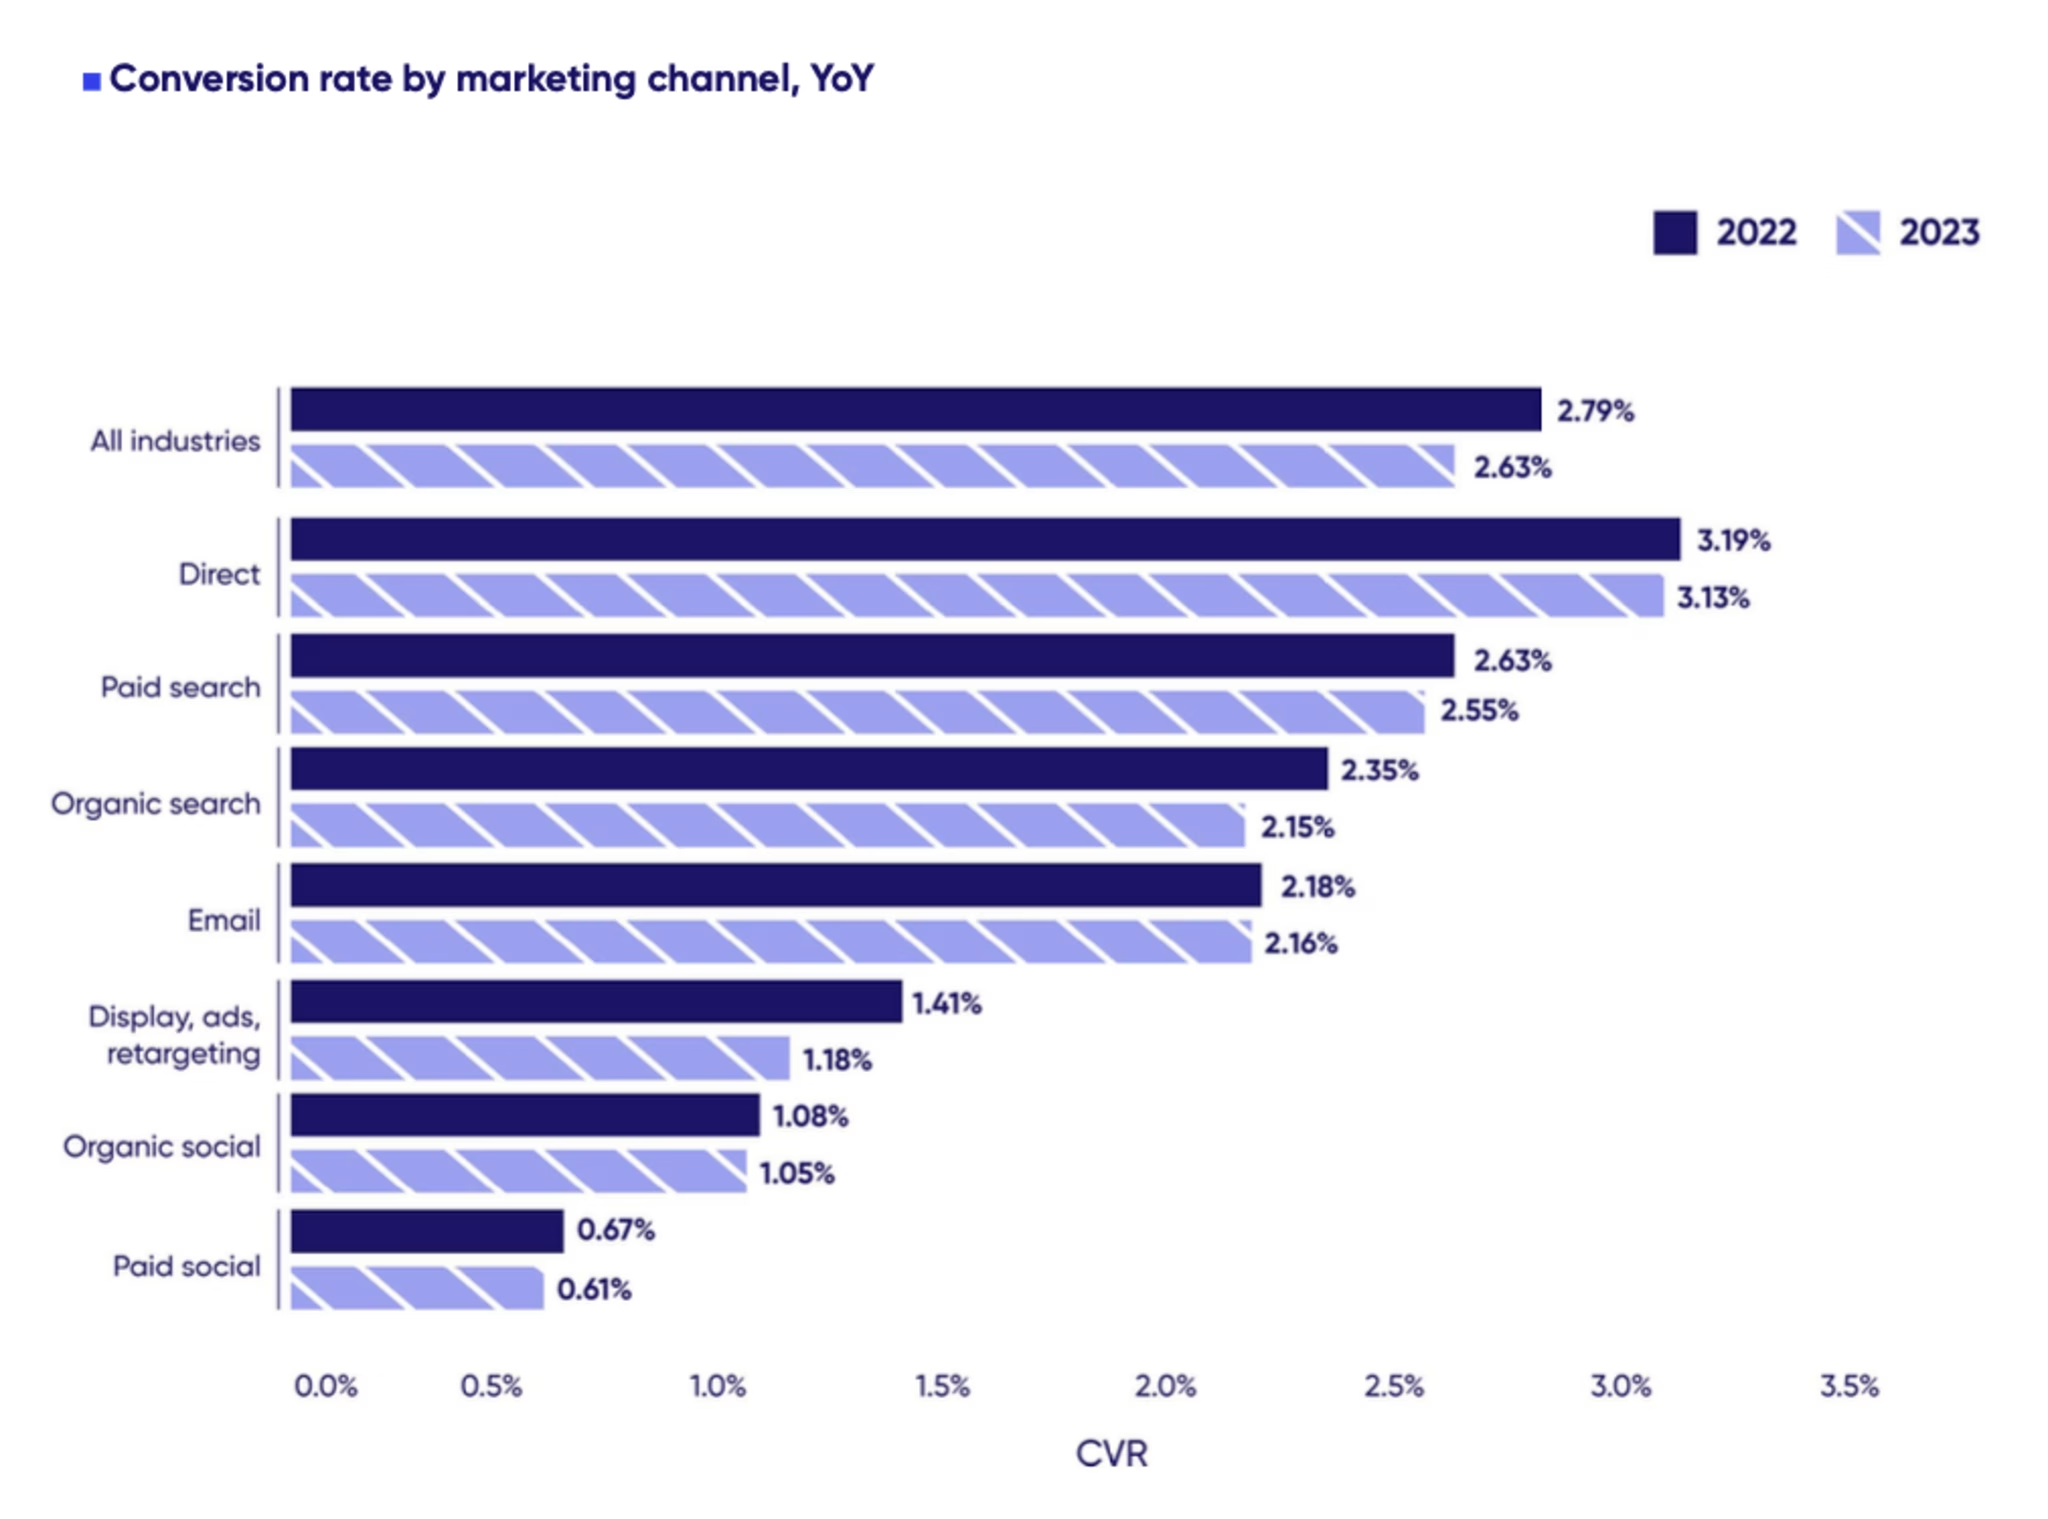
Then there’s the increasing importance of mobile traffic. As the chart below shows, desktop traffic’s conversion rate declined very slightly in 2023 but mobile traffic’s conversion rates declined -6.4%.
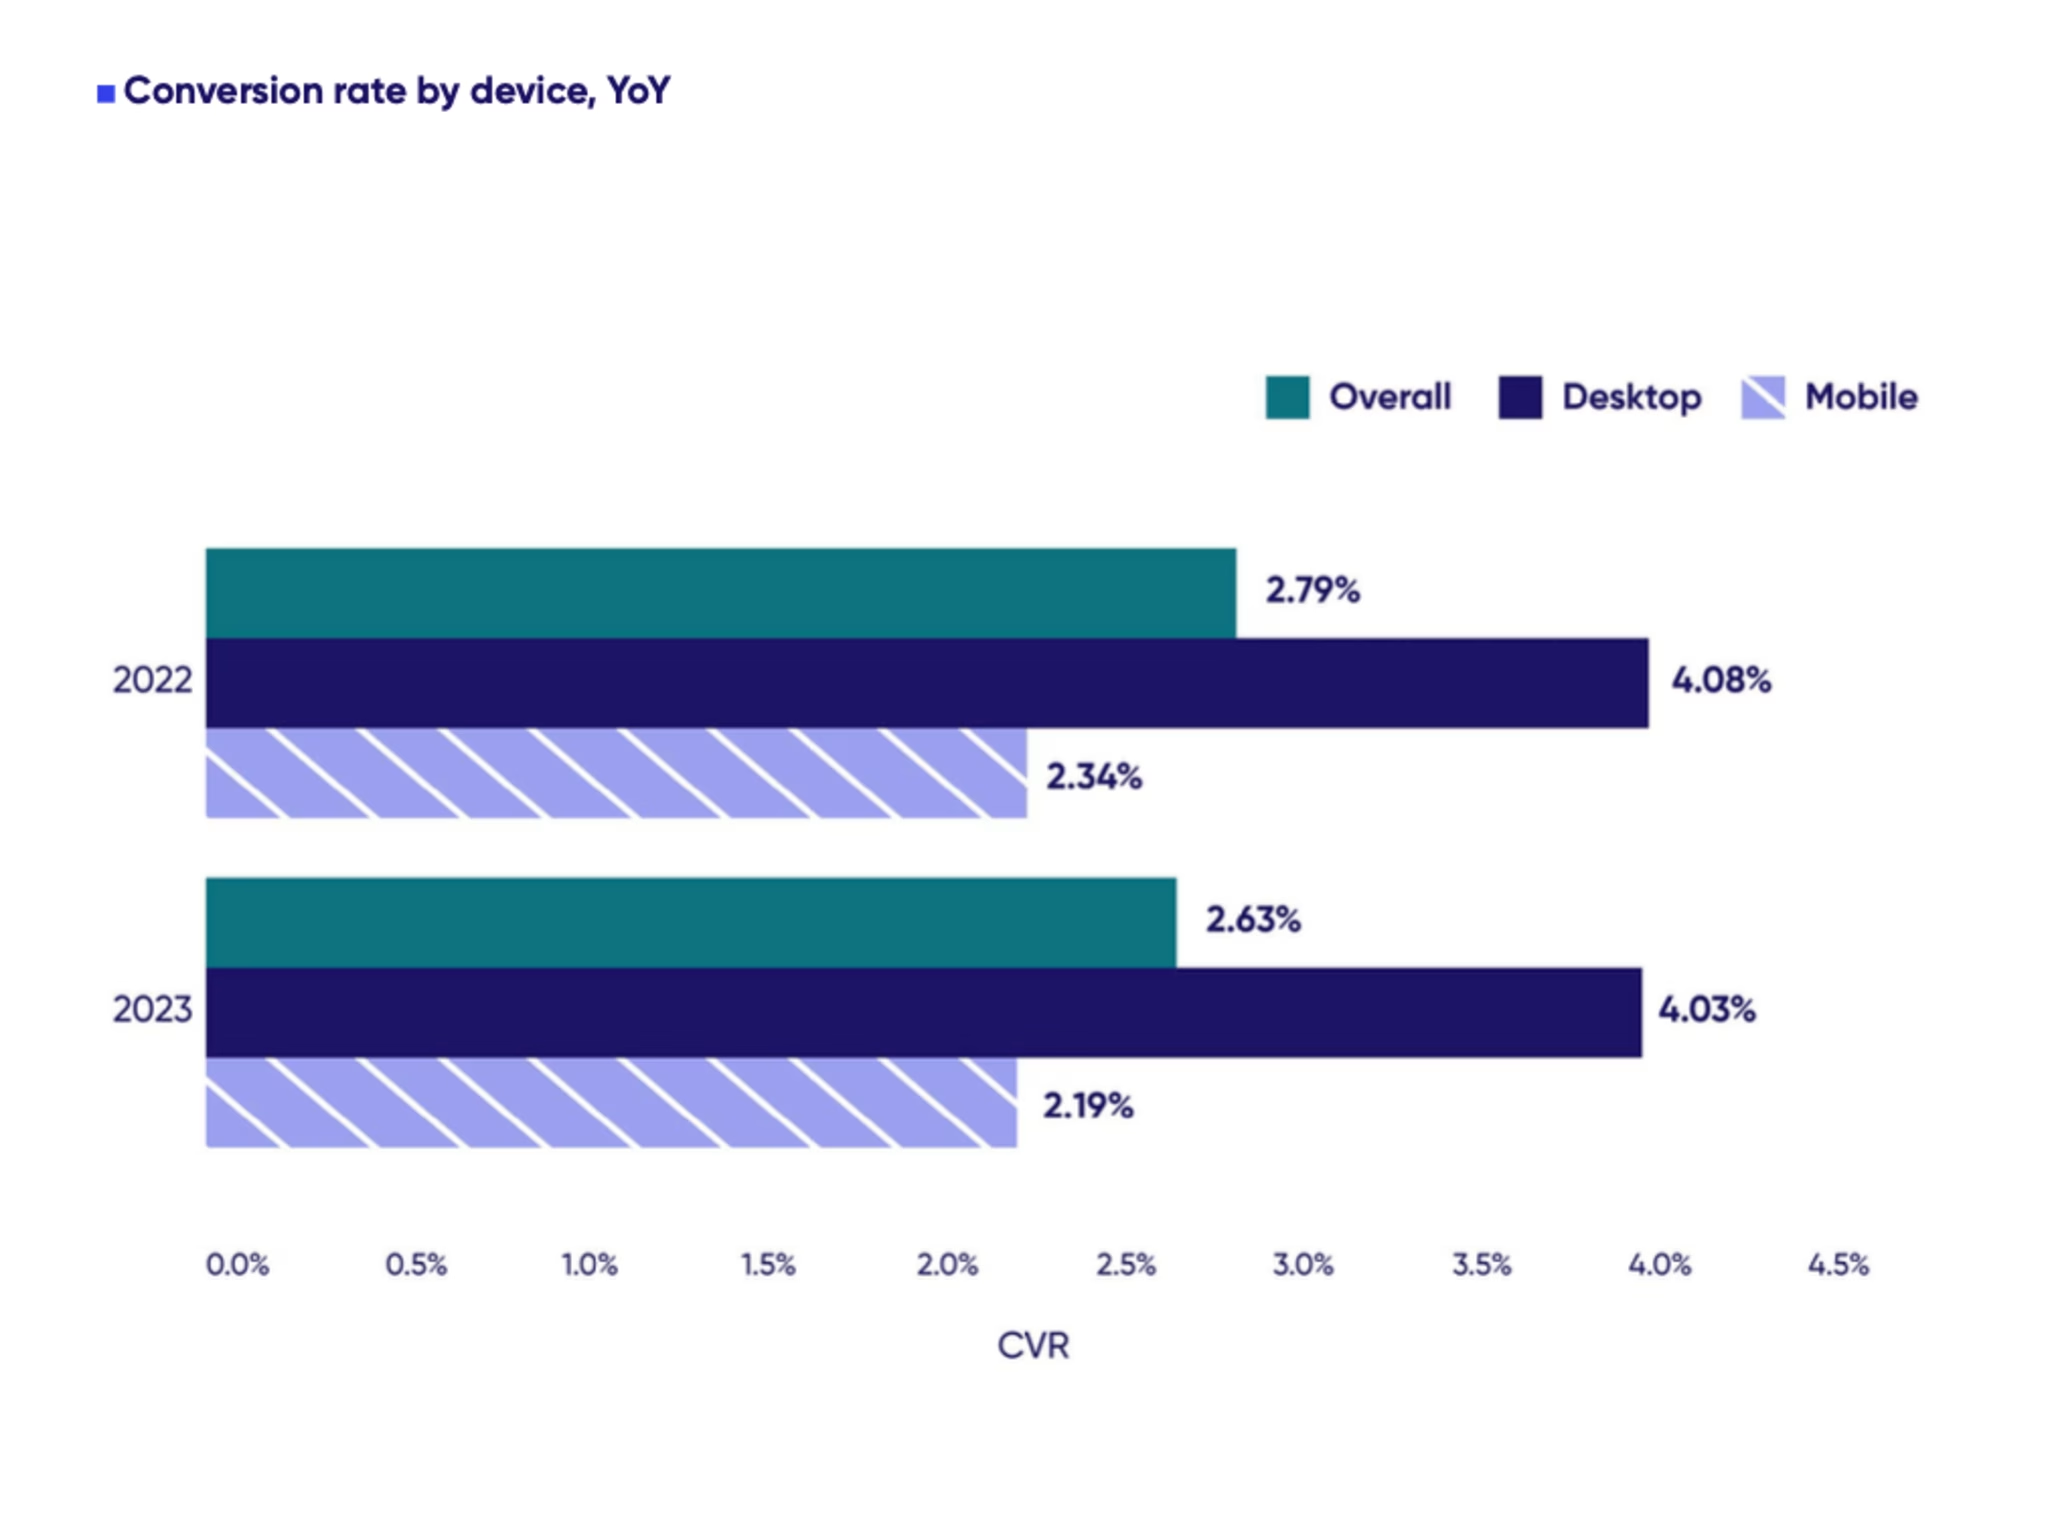
This is a great example of how the data analysis found in our report helps uncover the root cause behind the evolution of high-level metrics like conversion.
Only by understanding the traffic that’s coming into their websites and the behavior they can expect from site users can digital teams optimize their experience from end to end to drive better outcomes.
And that’s the understanding the 2024 Digital Experience Benchmark Report gives, breaking down the complete customer journey from end to end.
Get the data and insights you need to elevate your experience in 2024
It’s official: The benchmark for digital customer experience is here, ready for you to dive in and start picking up the insights that will inform your digital strategy and improve your experience throughout 2024—and beyond.
There’s not a moment to waste. Click the link below to access the 2024 Digital Experience Benchmark Report and Interactive Explorer. (And then spread the word.)
Frustration analyses are calculated for October 2023. All year over-year analyses are Q4 2023 / Q4 2022. All other analyses represent Q4 2023. Additional data hygiene factors are applied to ensure accurate metric calculation.
![[Visual] Jack Law](http://images.ctfassets.net/gwbpo1m641r7/6K99ulcVqLqKGyNZUaPiF8/145af0b27131005d862c790ddcafb3c5/Jack_Law.jpg?w=3840&q=100&fit=fill&fm=avif)
Jack has been creating and copywriting content on both agency and client-side for seven years and he’s ‘just getting warmed up’. When he’s not creating content, Jack enjoys climbing walls, reading books, playing video games, obsessing over music and drinking Guinness.
