When users browse online, they’re not always ready to buy — often, comparing products is a crucial part of their decision-making process. But switching between pages, tabs, and devices to weigh options can be frustrating, especially on mobile, where navigation is limited.
This friction explains why mobile traffic is high but conversion rates remain stronger on desktop.
To make comparing products seamless and user-friendly, here are practical design guidelines you can apply, including how to optimize comparison matrices for better user experience.
Why comparing products needs better UX Design
Comparing products is a key step in the buying journey, but poor UX design can make this process confusing and frustrating for users.
Without clear, intuitive comparison tools, customers are forced to jump between pages or devices, increasing the chances they’ll abandon their search altogether. A well-designed product comparison experience helps users easily identify differences, understand value, and make confident decisions.
All while reducing friction. In today’s competitive landscape, improving the UX of comparing products directly impacts conversion rates and customer satisfaction.
Keep product names, links, and purchase CTAs accessible at all times
Because most comparison tables can’t be viewed fully on desktop or mobile screens, it’s important to keep the most important information and actions fixed to the top of the matrix, such as linked product titles, prices, and purchase CTAs. As users scroll down, these elements should remain viewable to help encourage conversions.
Lengthy comparison tables can frustrate users who are only looking for a general overview of each product. So consider collapsing part of the table with an accordion to ’Show more’ based on user preference. This allows those who want a top-level comparison to see more content below the comparison matrix, and not get stuck in the finer details.

Product titles remain at the top of the page as users scroll the listed features, with the option to change the model of the product they’re comparing. Users can also interact within the table to see different visual specifications specific to each model, allowing the user to see the wider range of possibilities when choosing a product.

Once users add products to the comparison tool, the product names and conversion CTAs remain sticky at the top of the page.
Comparing products: Help users easily identify key differences
It’s unlikely your users will read every detail, so it’s imperative the design allows them to easily skim the differences. This helps them decide quickly which product is most appropriate for them.
3 top tips for your comparison matrix
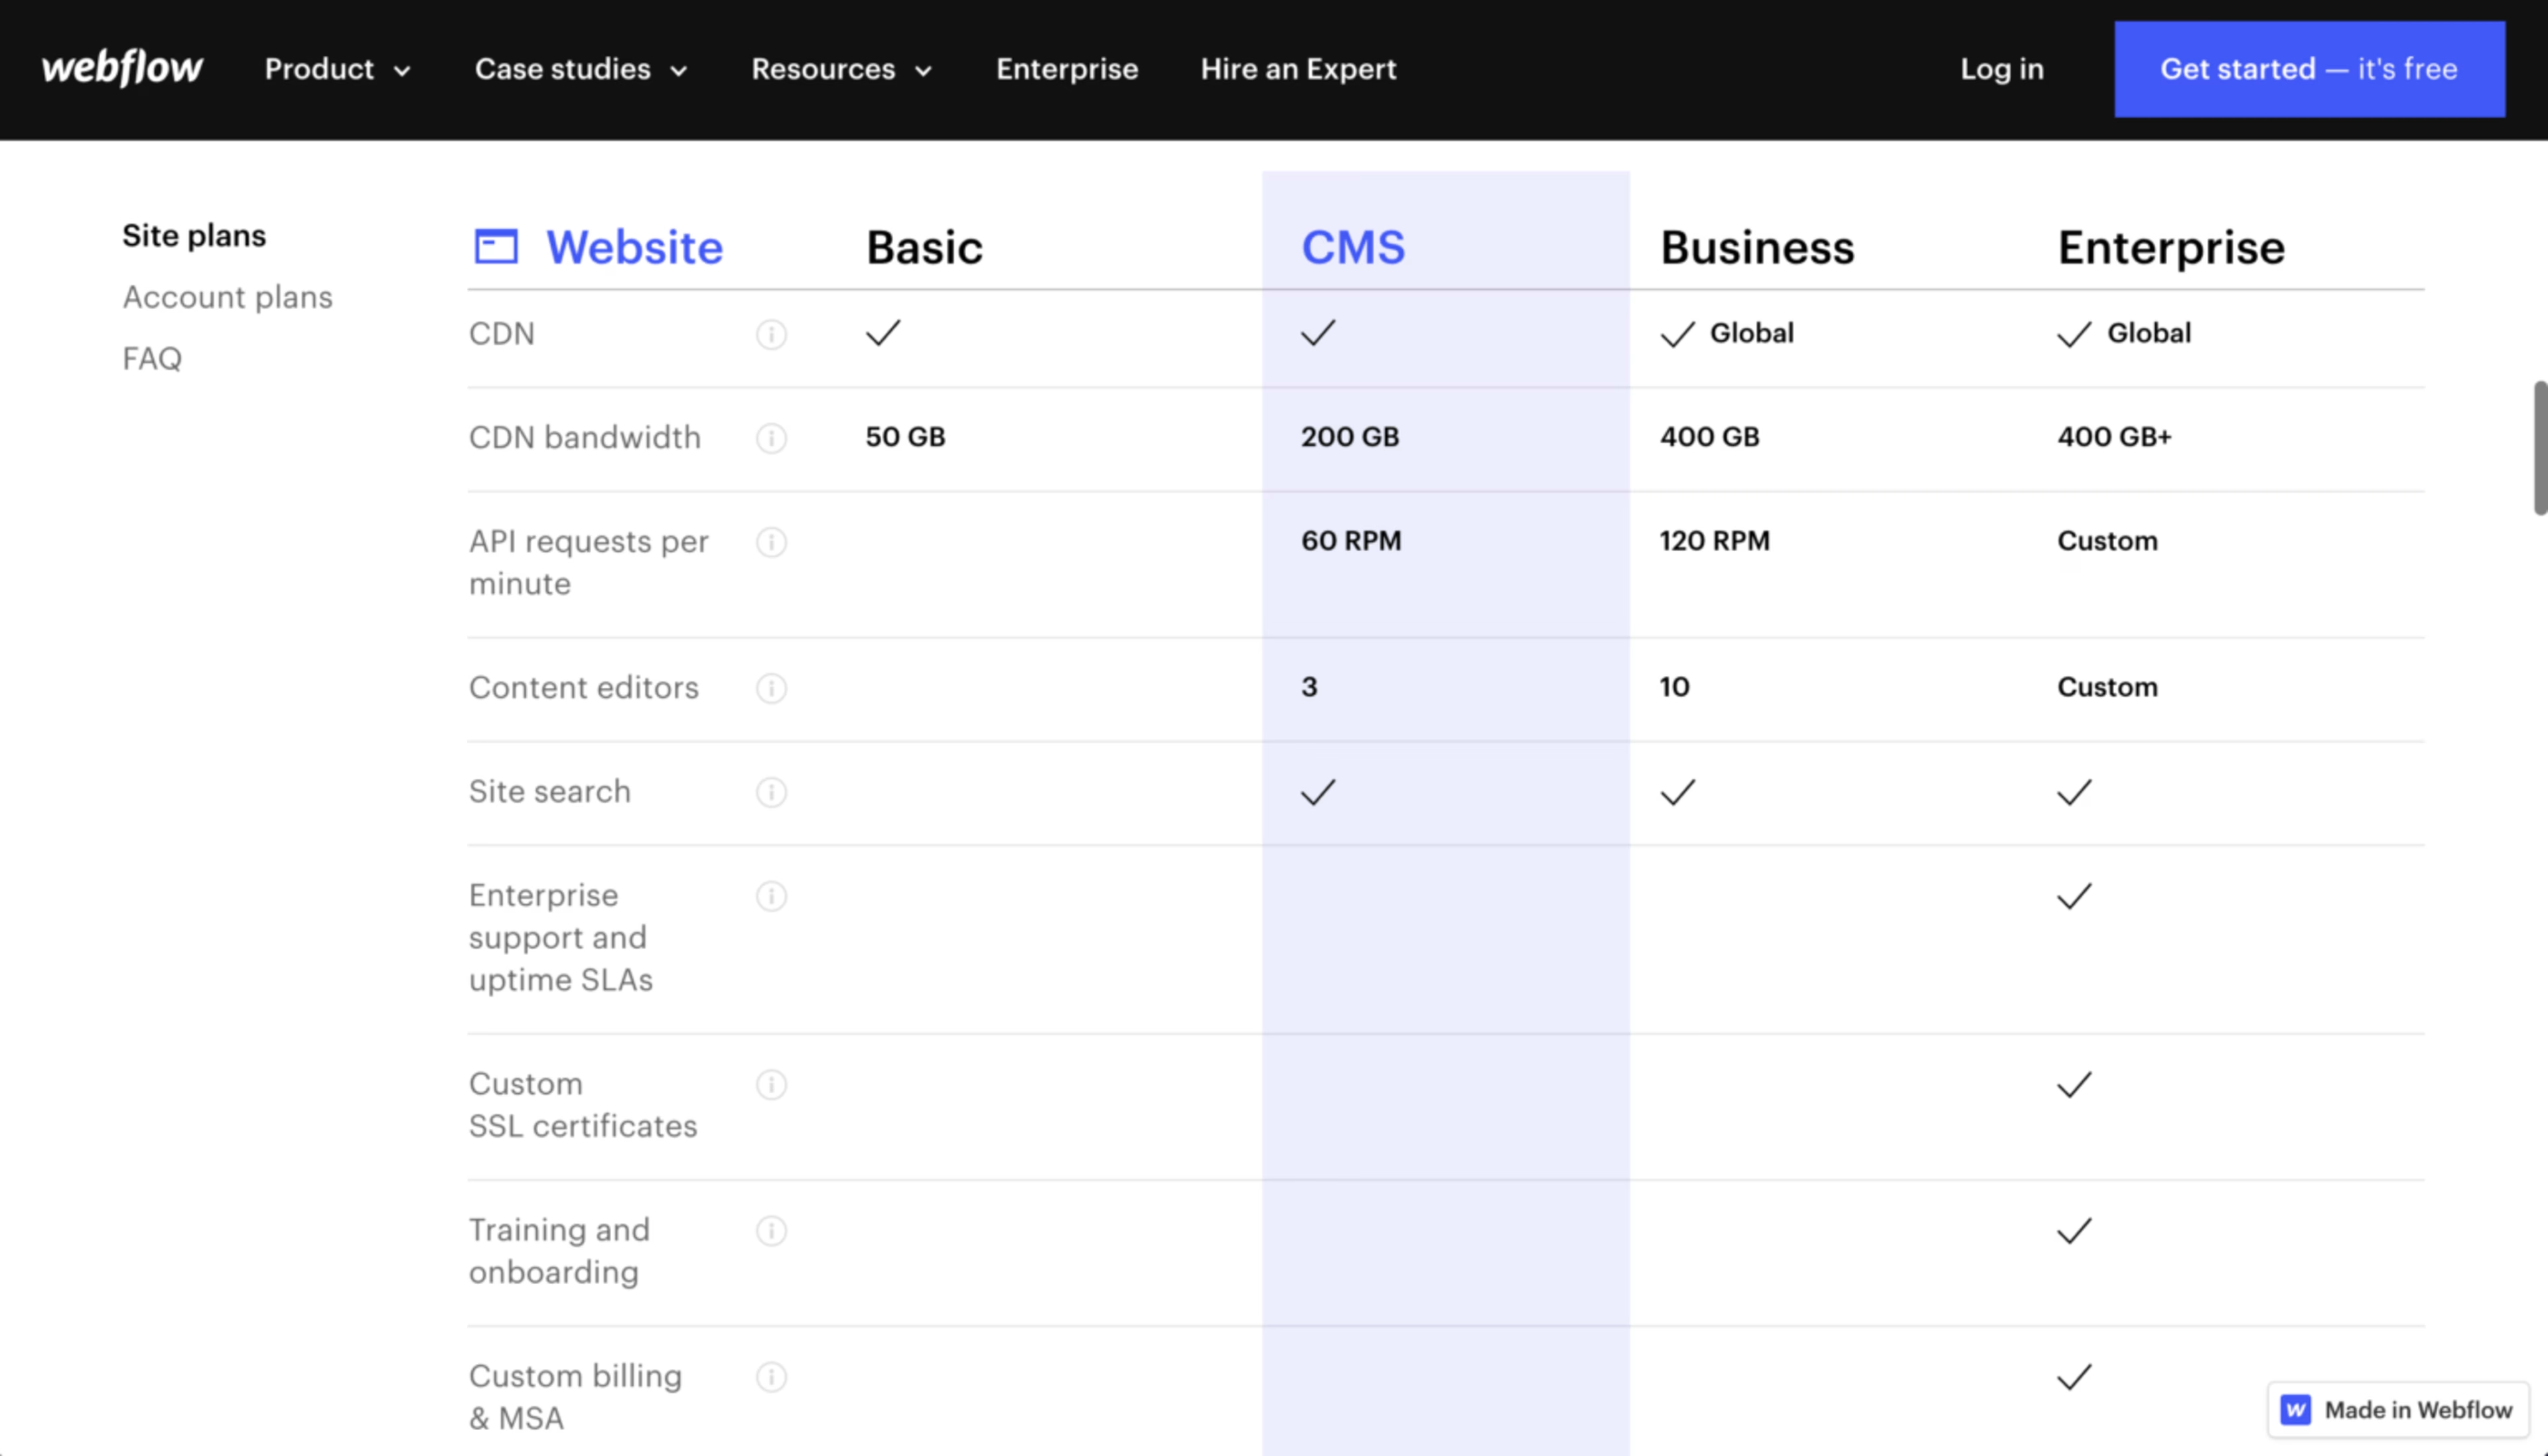
Use white space or hyphens to imply a lack of features, and check marks to indicate the existence of a feature.
If you include descriptions of features, use short and succinct phrases. Lengthy descriptions will hinder your user as well as clutter the matrix.
Avoid using text in every row or column; this defeats the purpose of the user being able to compare products easily.

The key differences are easily seen with the use of white space. There is no attempt to fill every row with information, which allows the user to see clearly which plan has the most features. Text is only used when the products all contain the same features and they are clarified further to delineate the differences.

The comparison tool takes advantage of the horizontal scroll on mobile to allow users to compare many products at once. Users can also toggle the table view to highlight the key differences, making it easier to spot which features are differentiated by product. In addition, the user is provided a preview of the main features, with an option to expand the rest of the details. The comparison tool even compares reviews and ratings from customers.
Comparing products: Answer common questions as users browse the product comparison
Though highly informative, the comparison matrix is unlikely to answer all your users’ questions. They may have common questions about your line of products or pricing that isn’t necessarily a highlighted feature. They may also need clarification on specific features that the table doesn’t provide.
It’s important to answer common questions here, as the comparison page is a key conversion point of the journey. Make sure to check which types of product pages are more likely to lead to conversion using Page Comparator within the Contentsquare platform. Then understand whether navigation away from the page is likely to lead to an exit using our Journey Analysis feature.
In this case, tooltips within the matrix or a condensed section of FAQs below the matrix are both extremely effective methods of answering common questions. Rather than rely on graphic icons to delineate tooltips, consider using text to phrase common questions as the tooltip itself. Tooltips phrased as common questions are more relatable and easier to spot than a smaller graphic icon.

Comparing products: Use a soft offer close to the main CTA
Providing a soft offer can be the golden ticket when encouraging users to try the product without a full commitment. Promoting free trials or offering a free consultation close to the main CTA can be an effective way to reach prospective clients.

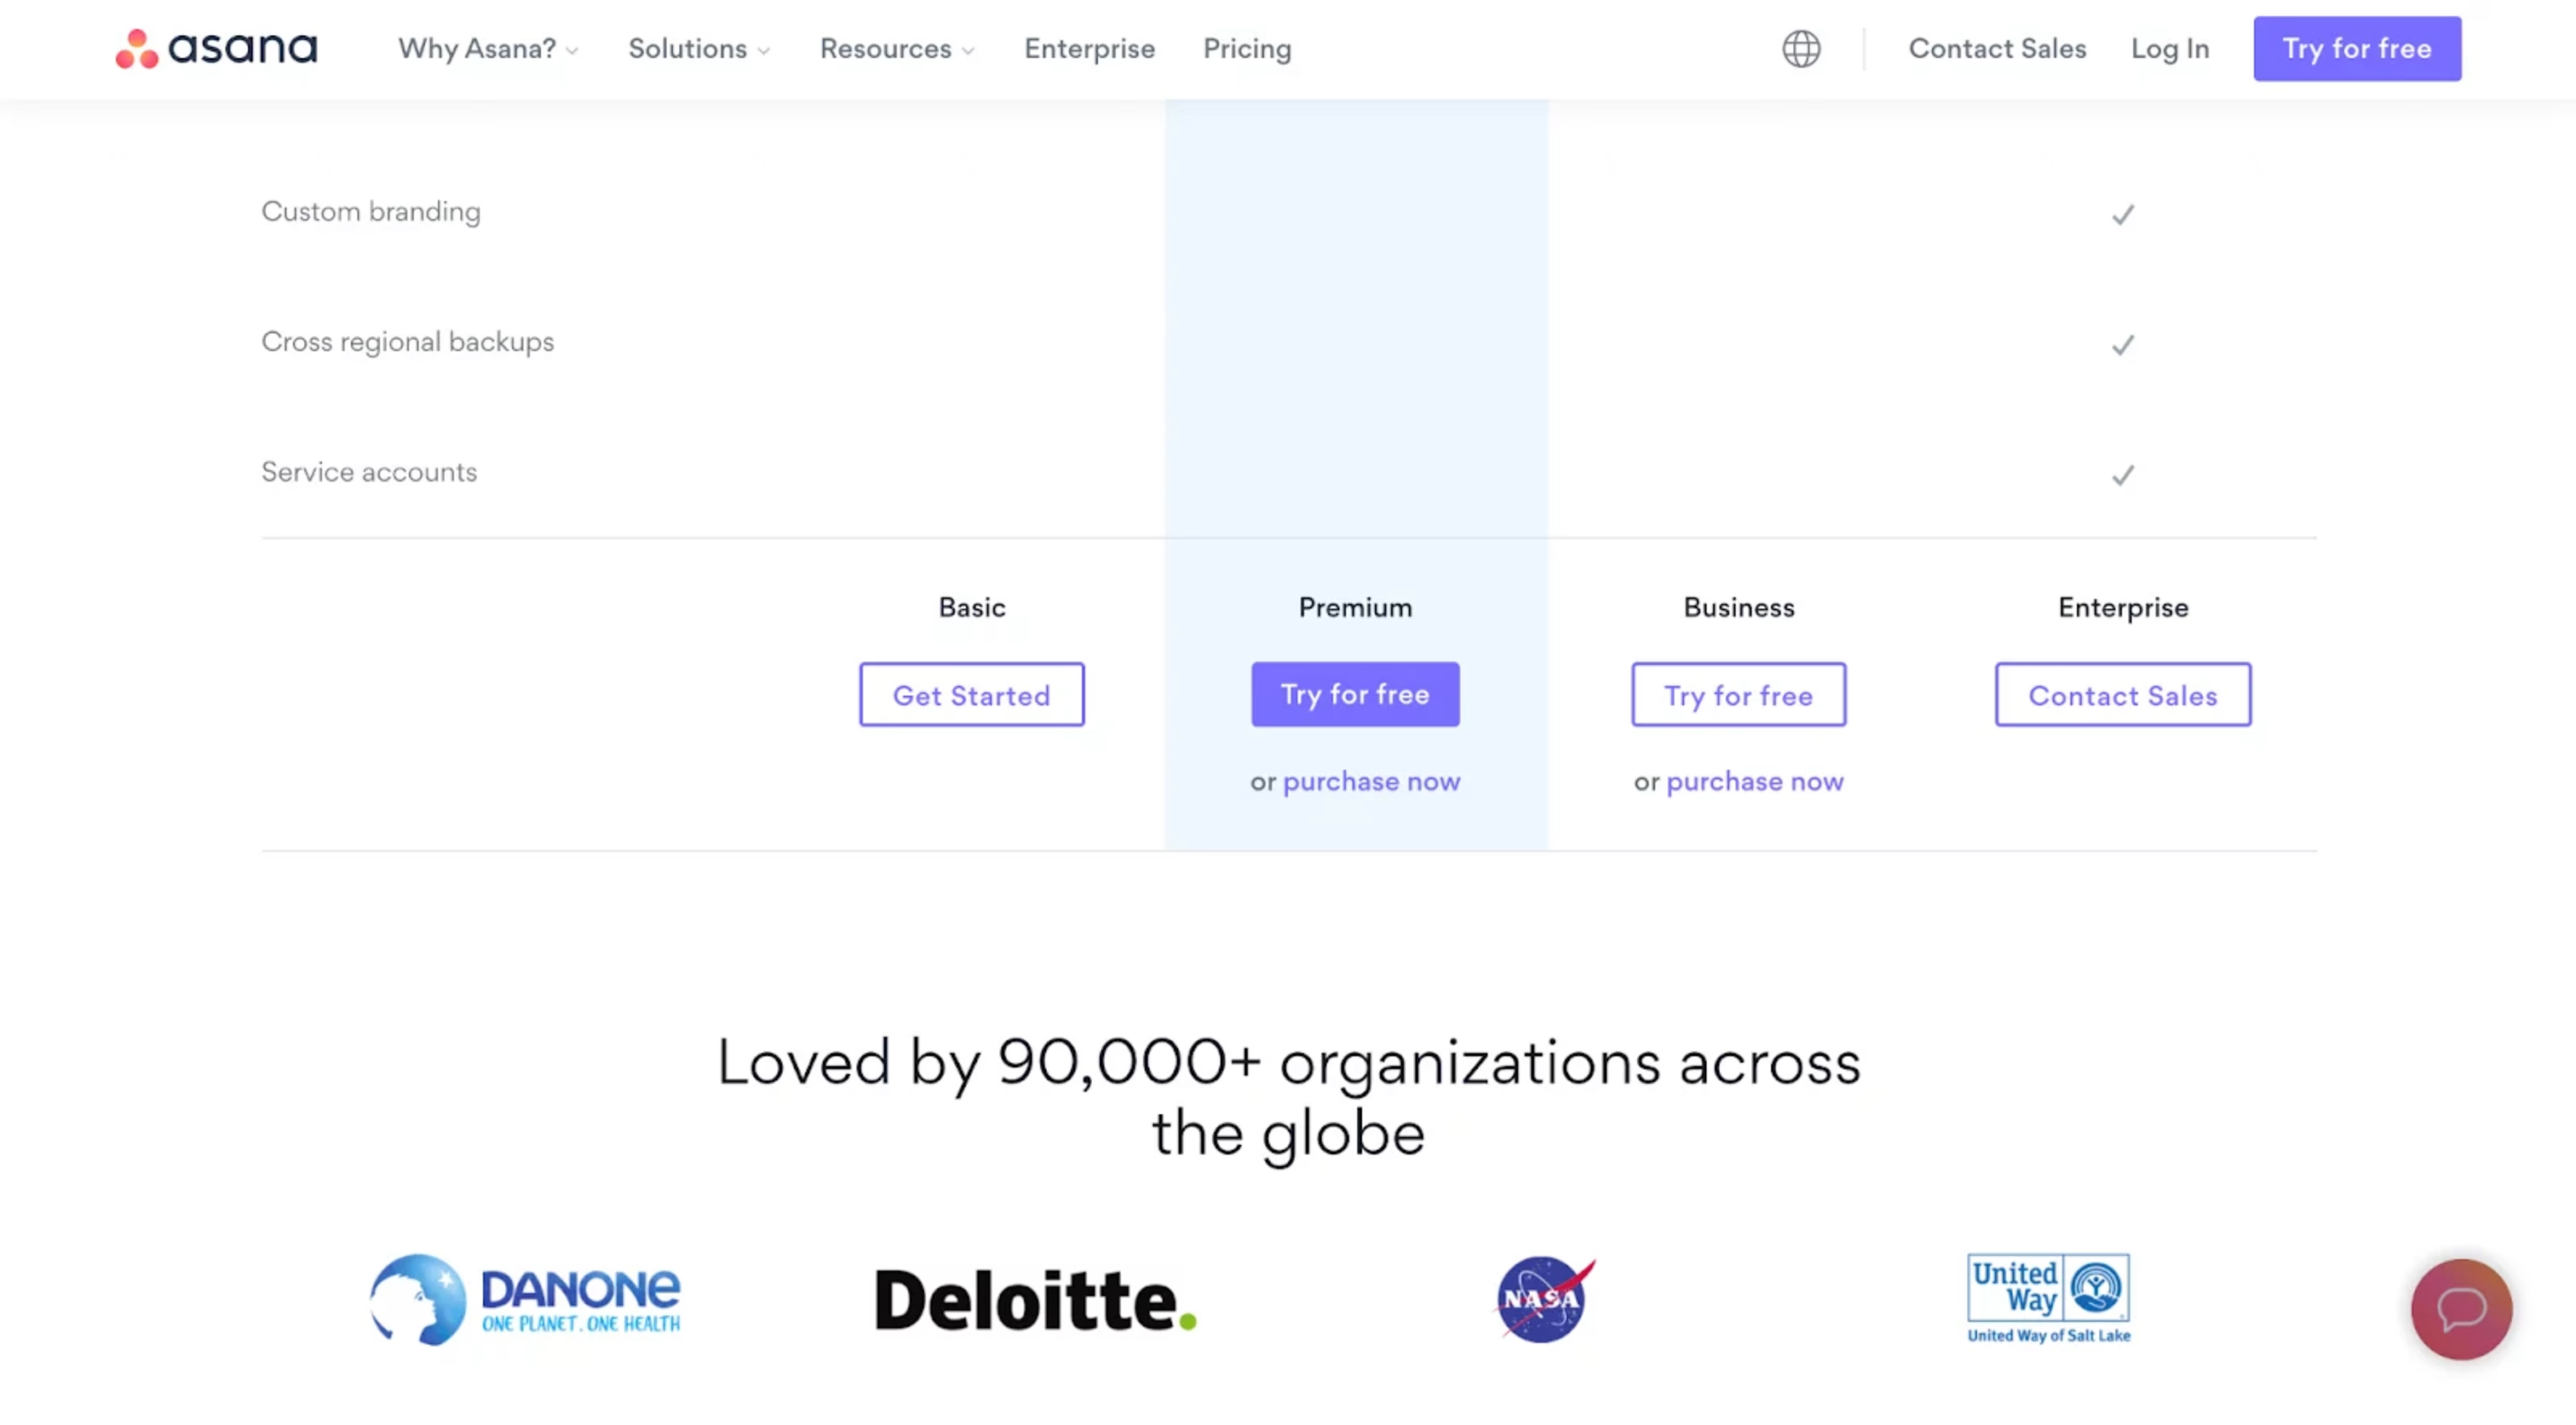
The product CTAs and titles remain sticky at the top of the matrix, with an emphasis on starting a trial.

The CTAs focus on trying a free trial, but offer a text link for users that are ready for more commitment.
Be transparent about pricing prior to checkout
Lastly, because many products have various pricing methods and commitments – annual versus monthly, for example – it’s important the user understands exactly what they’re signing up for.
Allow users to toggle different views of the comparison matrix that adjust the pricing to their specifications. Clearly state whether users are expected to make annual commitments, and whether plans or products can be canceled at any time.

Users can easily toggle the different pricing options; the price adjusts based on the selected method.
Remove customer friction with Contentsquare
Find out why your customers behave the way they do with our industry-leading customer experience analytics platform. Use our Session Replay feature to understand why customers aren’t interacting with your chatbot design, or discover your most profitable digital paths with in-depth Sunburst visualizations, covering data from 100% of your customer journeys.
Interested to learn more? Book a demo with us today.
FAQ on comparing products
Comparing products helps users make informed decisions by evaluating different options based on features, price, quality, and reviews. A seamless comparison process builds trust and reduces hesitation, making users more confident in their final choice.
Michelle is a UX/UI Designer who loves finding design solutions that marry both business and user needs. When she’s not designing, you can find her pursuing yet another new hobby, visiting a museum, or laughing a little too loudly somewhere in the distance.
