4.7
G2
4.7
Gartner
eコマースおよび小売業界向けContentsquare

購買ユーザーにクリックしてもらうには

軽い気持ちでサイトを訪れた閲覧者を、忠実な購入者に変えましょう。コンバージョンを促進する根本的な要素を明らかにするインサイトを獲得できます。

Why Contentsquare? Compare what actually matters

Contentsquare

Icon — Checkmark
Find and fix high-impact drop-offs
See exactly where shoppers abandon product pages, carts, or checkouts—and understand why, with AI-powered behaviour insights.
Icon — Checkmark
Optimize every journey, not just the funnel
From homepage to post-purchase, get a full picture of customer journeys across devices, channels, and touchpoints.
Icon — Checkmark
Prioritize what drives revenue
AI surfaces which UX issues are hurting sales the most—so you can fix what matters and drive measurable growth.

Traditional tools

Icon — Cross
See exits, not explanations
Funnels show where users drop off—but don’t reveal what caused hesitation, frustration, or bounce.
Icon — Cross
Limited view of the real journey
Siloed data and last-click attribution miss the complexity of today’s omnichannel ecommerce journeys.
Icon — Cross
Hard to know what to fix first
Without AI or behavior analytics, it’s guesswork deciding which UX changes will actually improve conversions.
Guide
Get the Free Ebook for your PLPs

Get 80+ actionable insights to improve your Product Listing Pages (PLPs). Contentsquare analyzes billions of user behaviors to deliver unique metrics, visualizations, and recommendations that help digital teams optimize the PLP experience.

File — Test Resource CTA Thumbnail
john-lewis-partners-logo
+
5932
2
6597
7
.
2673
3
%

キャンペーンバナーのエンゲージメントが向上

プロダクトの紹介動画を見る
rhone
+
2133
3
8017
7
%

目標値を超え、前年比売上が増加

プロダクトの紹介動画を見る
EasyJet-logo
+
6577
7
.
2953
3
%

特定のカスタマージャーニーからの収益が増加

プロダクトの紹介動画を見る
ocado
+
4216
6
6080
0

Contentsquareの平均月間ユーザー数が増加

プロダクトの紹介動画を見る
admiral-logo-color
+
9521
1
5325
5
%

品質保証分析アウトカムのスコアが85%から15%上昇し、98%に

プロダクトの紹介動画を見る

購買ユーザーを再訪問客に変える

オンラインの売上、収益、リテンション率を高めるような、差別化されたショッピング体験を創出します。このオールインワン・プラットフォームを導入すれば、複数のセッションに渡ったり、eコマースプラットフォームをまたいだりする体験を包括的に理解できます。

購買につながる体験を創出

エラー、パフォーマンスの遅さ、ユーザビリティの問題など、購買ユーザーの潜在的なフラストレーションを明らかにすることで、効果的なデジタル体験を創出できます。

  • 購買ユーザーがどのように商品カテゴリーを行き来し、商品を探しているのかをリアルタイムで可視化します。

    Create - level of frustration

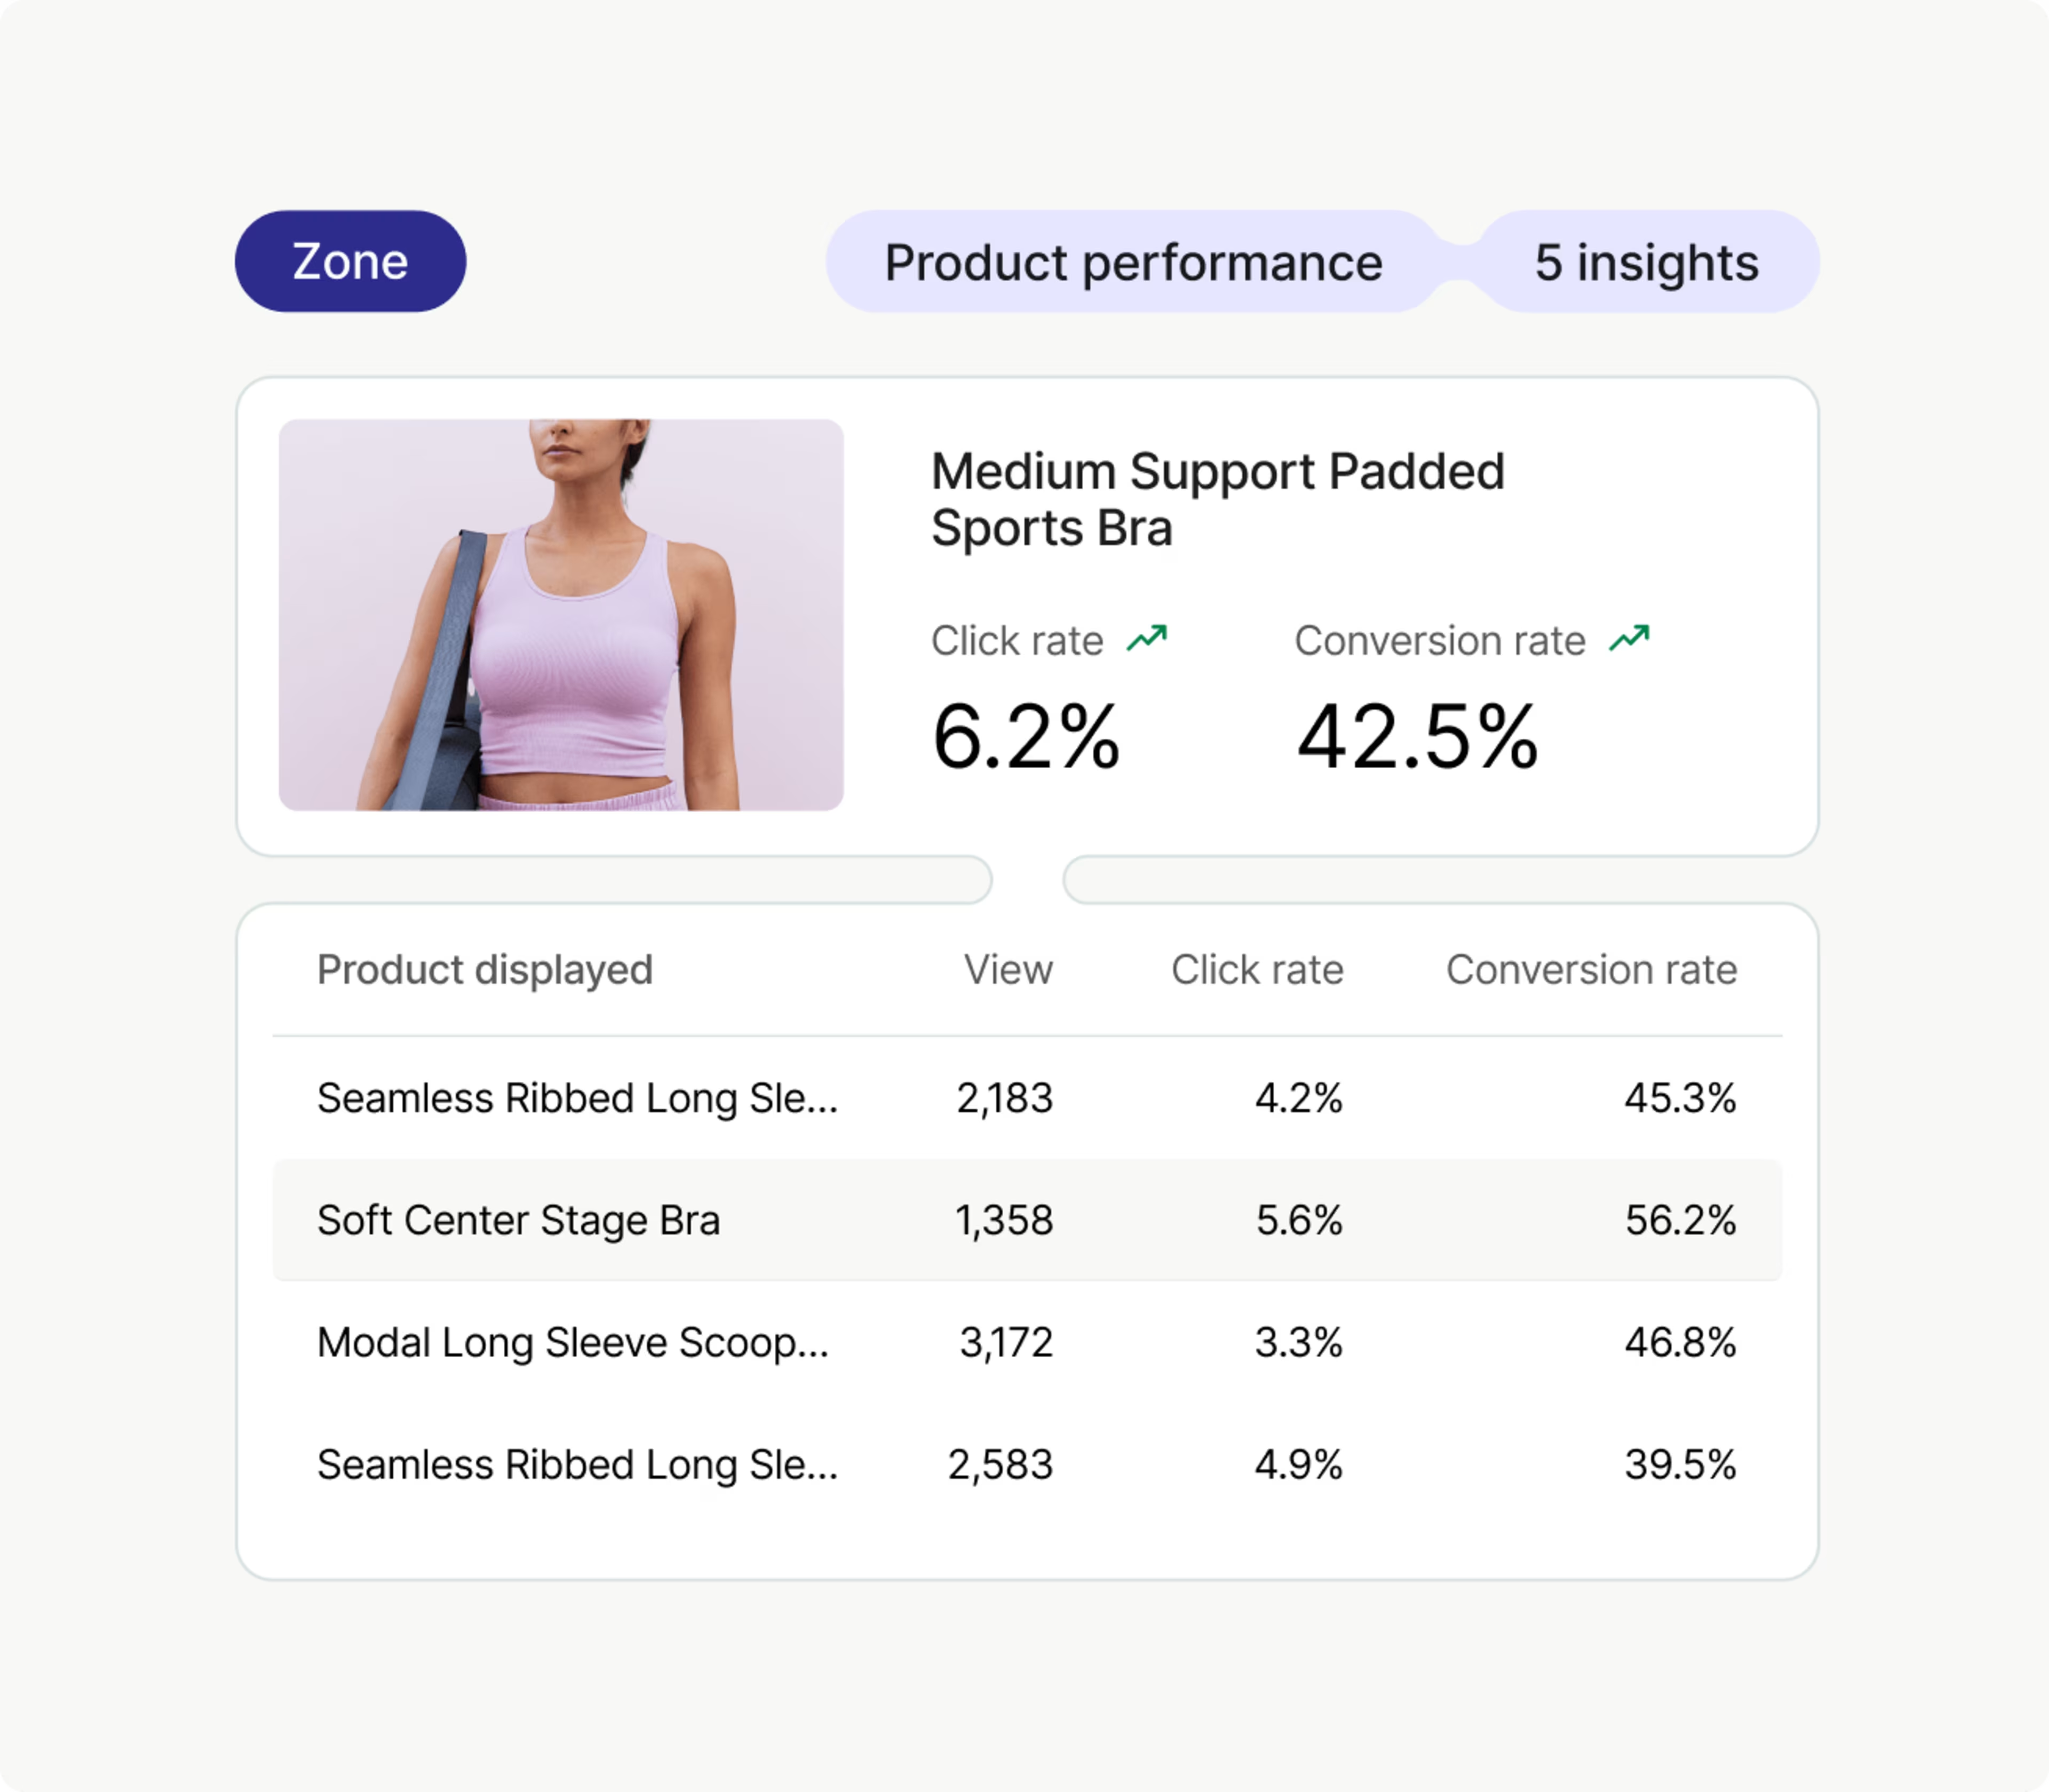
eコマースプラットフォーム全体でプロダクトパフォーマンスを最適化

主要な指標と顧客インサイトを活用して、商品構成の調整や体験のカスタマイズを行い、ショッピングジャーニー全体で収益性を向上させます。

  • 購買ユーザーがカスタマージャーニーを進む商品に時間をかけ、コンバージョンにつながらない商品にかける時間は減らします。

    Optimize - Product Performance

このツールには本当に感心しています。初めて見たときはとても驚きました。 抽象的なデータや数値の羅列ではなく、当社のウェブサイトでユーザーが何をしているのかが本当に分かるのです。ユーザー体験を、視覚的に理解できるようになりました。

Jan-Willem Wilmsen
E.ON デジタルスペシャリスト

すべての分析を一元的に行い、クリックしたユーザーを忠実な顧客に変える

よりスマートな顧客インサイト、強力なリテンション戦略、つながりのある分析により、購買ユーザーの獲得とリテンションへの投資を最大限に活用します。当社のプラットフォームでは、高精度の自動トラッキング、定性データ、定量データなど、多くのことを簡単にご利用いただけます。

  • eコマースのテクノロジースタック全体にわたって顧客インサイトを統合します。すべてのタッチポイントでよりスマートな意思決定を促進し、より効果の高い結果をもたらします。

    Turn - Sales Performance