![[Visual] Website monitoring Checklist Header](http://images.ctfassets.net/gwbpo1m641r7/28V4u2ZjcAoBy3805D8mkV/a87f42078ded3e74b73bc55e979a0783/AdobeStock_963706233.jpeg?w=1280&q=85&fit=scale&fm=avif)
User activity tracking is the process of monitoring, collecting, and analyzing visitor browsing behavior on a website or app.
Read on to learn how you can track user activity on your website with visually engaging behavior analytics tools like heatmaps and session recordings to understand what's happening, fix functionality issues, and spot those all-important optimization opportunities.
Key takeaways
Google Analytics provides foundational traffic data, but behavior analytics tools like heatmaps and session recordings reveal why users behave as they do
Track clicks, scrolls, mouse movements, and user journeys to identify friction points and optimization opportunities
Combine quantitative tracking data with qualitative user feedback for complete customer understanding
Ensure privacy compliance by using tools that mask sensitive data and support GDPR/CCPA requirements
User activity tracking tools comparison
Choosing the right website tracking tools depends on what you need to learn about your users. Here's how the four main categories of user tracking software compare.
Tool Category | What It Tracks | Best For | Example Tools |
|---|---|---|---|
Web analytics | Traffic sources, pageviews, conversions, user demographics | Understanding overall site performance and traffic patterns | Google Analytics, Adobe Analytics |
Behavior analytics | Clicks, scrolls, mouse movements, session replays, rage clicks | Visualizing how users interact with specific pages and identifying friction | Contentsquare (Heatmaps, Session Replay, Journey Analysis) |
User feedback | Survey responses, NPS scores, open-ended comments | Understanding why users behave as they do and what they want | Contentsquare Surveys, Qualtrics |
A/B testing | Conversion differences between page variations | Testing hypotheses about what design changes improve performance | Optimizely, VWO |
For most teams, the most effective approach combines Google Analytics for traffic data with a behavior analytics platform like Contentsquare for visual insights into user interactions. This gives you both the 'what' and the 'why' of user behavior.
To get that full picture, businesses rely on a range of tracking software tools. Here are the four most common methods for monitoring user activity:
Quantitative tracking tools like Google Analytics
Click tracking (recording which elements on a page users click)
Scroll tracking (recording where users scroll on a page)
Viewing session recordings of users as they use a site
We'll go over these tracking methods in detail below and show you how to use them effectively.
How to track users with Google Analytics
![[Visual] google-analytics-dashboard-ga4](http://images.ctfassets.net/gwbpo1m641r7/6gV7ZXtXcBzYdnNXGxxOFx/0b77dd7fd642a7b80ca39c9255edd201/google-analytics-dashboard-ga4__2_.png?w=750&q=85&fit=scale&fm=avif)
The GA4 dashboard showing website analytics overview
Google Analytics (GA) is the most popular traditional web analytics tool, used by 74% of web analysis professionals. If you already work with GA, you can skip to the next section. If not, here's a quick overview of the set-up process:
1. Create and configure your Google Analytics account
In 2020, Google launched a new version of Google Analytics called Google Analytics 4 (GA4) (this version replaced the older Universal Analytics version in July 2023).
Here's how to set up GA4.
And here's how to switch from Universal Analytics to GA4.
2. Add GA tracking code to your pages
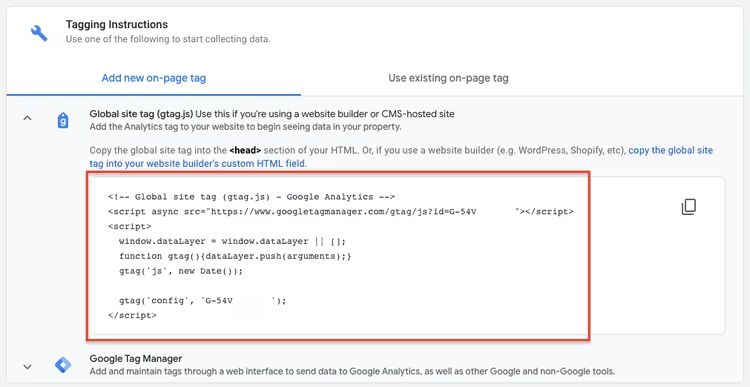
The GA4 tracking code snippet for website implementation
Paste the global site tag into the section of every page, or add it with Google Tag Manager.
3. View reports
![[Visual] GA4 - Google analytics - user-location-tracking-google-analytics-4-1](http://images.ctfassets.net/gwbpo1m641r7/10Cp4Bubp1TJ01rpmA8GhC/a2f0d17a8535e894a73e1deecaf75fd5/user-location-tracking-google-analytics-4-1.png?w=750&q=85&fit=scale&fm=avif)
Realtime website traffic overview in GA4
Google Analytics will generate reports as soon as you get some traffic to your site.
Start with the Realtime report (Reporting > Realtime) to view live website traffic data and verify that GA is set up correctly.
Limitations of Google Analytics
GA lets you track many useful quantitative metrics, like ecommerce transactions, custom events, and conversions, but there are two main issues:
There's so much data it can be overwhelming: getting started with GA is fairly straightforward, but becoming an expert can be a full-time job (literally).

Google Analytics: it's a full-time job
There are so many features and options, and GA4 produces radically different reports to the ones we've been used to for the past 5-10 years. Our survey of analytics professionals revealed that one-in-five people found website tracking tools like Google Analytics to be overwhelming (and that was before GA4).
GA doesn't tell you why users behave as they do: for example, you might learn that a landing page has low engagement from GA data, but you can only guess what's causing it. That's why you need to pair GA with user behavior analytics to complete the picture and find out how users really experience your site.
Key user behaviors to track
Before diving into specific behavior tracking tools, it helps to understand what user behavior data you should be collecting. Here are eight key metrics and behaviors that give you actionable insights:
Pageviews and sessions: how many times users visit specific pages and how long they stay
Bounce rate: the percentage of visitors who leave after viewing only one page
Click patterns: which buttons, links, and elements users interact with
Scroll depth: how far down the page users scroll before leaving
Session duration: how long users spend on your site during a single visit
Conversion events: when users complete key actions like purchases, sign-ups, or form submissions
Rage clicks: repeated clicks on the same element, often indicating frustration with non-responsive or broken features
Form interactions: where users abandon forms or struggle with specific fields
Tracking rage clicks and other friction signals is particularly valuable for identifying usability issues. Contentsquare's frustration score automatically surfaces sessions where users show signs of struggle, helping you prioritize which problems to fix first.
How to track user activity with behavior analytics
Behavior analytics is the process of tracking and analyzing quantitative and qualitative user data to identify how people interact with your website or product, and why.
Behavior analytics tools give you direct visibility into how users experience your site, adding crucial context to the numbers. Using them together gives you a clearer picture of what's happening, why it's happening, and how to fix it, so you can optimize UX and improve conversion rates.
Here's how to get started with the two most popular behavior analytics tools: heatmaps and session recordings.
Track where users click, move, and scroll with heatmaps
![[Visual] website monitoring Heatmaps & Engagements](http://images.ctfassets.net/gwbpo1m641r7/zSEt2fD70YN0KvCJ6Aycj/31e98fd778c4cc54879e524d717f5c91/Heatmaps___Engagements__3_.png?w=1002&q=85&fit=scale&fm=avif)
Generate various types of heatmaps with Contentsquare
The easiest way to track and visualize where users click, move, and scroll is to use heatmaps.
Website heatmaps are visual representations of the most popular (red) and unpopular (blue) elements on a page, giving you an at-a-glance understanding of what people look at and ignore, for example whether users actually click on your calls-to-action (CTAs).
There are three main types of heatmaps:
Scroll heatmaps show how far down the page users scroll, and the average fold position
Click heatmaps show where website visitors click (and tap on mobile)
Move heatmaps show how users move their mouse as they browse
Other heatmaps go beyond just the basics: Contentsquare rage click maps, for example, track repeat clicks and help you visualize points of user friction on a page. They're a great tool to track functionality issues because they quickly expose non-clickable or broken elements that frustrate users.
When you're ready to start tracking, here's how to set up a heatmap on a website or single-page application (SPA) in just a few minutes:
1. Sign up for Contentsquare
Contentsquare is an AI-powered customer experience intelligence used on over 1 million websites worldwide. The platform's Heatmaps capability requires virtually no setup and will give you immediate insights from the moment you install your tracking code.
2. Add the Contentsquare tracking code to your website
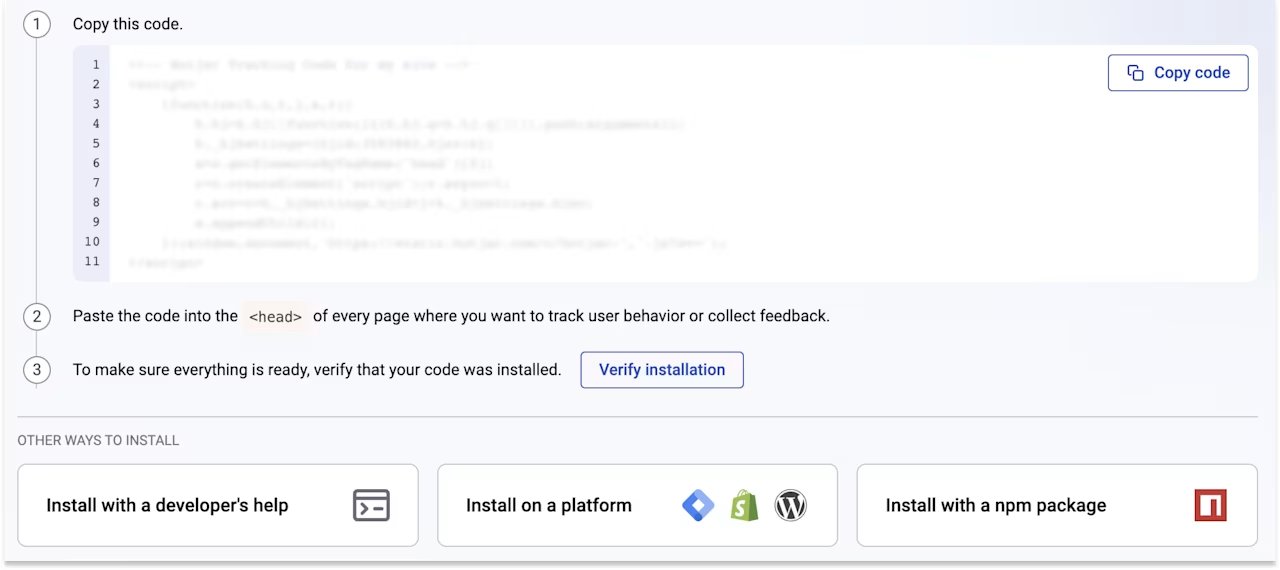
Simply copy and paste your Contentsquare tracking code or install it directly on a platform
You can add the Contentsquare tracking code via Google Tag Manager by pasting the JavaScript snippet into the of every page you want to track, or by using the official Contentsquare plugin on your WordPress site or online platform.
3. Create a new heatmap
Once you're in the Contentsquare dashboard, select 'Heatmaps' from the left column, then click the 'New heatmap' button.
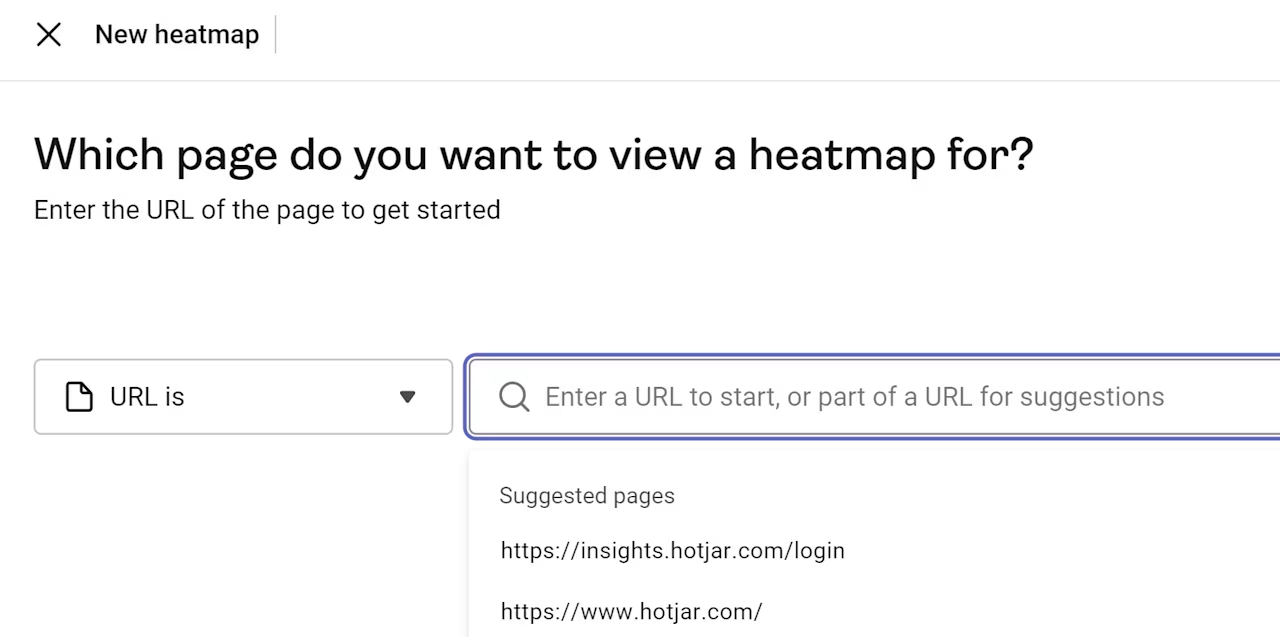
Enter the URL of the page you want to track, then select the type of heatmap you want to set up.
Your selection will take you back to the Contentsquare dashboard where you can edit the heatmap. Don't forget to name it something descriptive (e.g. 'product landing page').
And that's it: you can view your new Contentsquare heatmap from the first recorded pageview.
It will look something like this:
![[Visual] Heatmaps Hero](http://assets.ctfassets.net/gwbpo1m641r7/3rsPCC46zgs1tnzJUW9bbG/9a7f0b32546c54737157e804ae4a4d41/Heatmaps_Hero_Visual.avif?w=1280&q=85&fit=scale&fm=avif)
You can view heatmaps by device (desktop, tablet, or mobile) and heatmap type (click/tap, scroll, move, rage click, and engagement zones).
If you want to get more insight from your heatmaps, here's our detailed guide to creating a heatmap (including the best pages to collect data on), and how to analyze your heatmap once the data's flowing in.
Pro tip: streamline your heatmap analysis with zone-based heatmaps in Contentsquare. This heatmap combines data from click, move, and scroll maps into one visualization that shows which elements users interact with the most.
Tracking this behavior helps you understand what your users find most valuable, so you can figure out if any elements need rearranging on the page to improve the customer experience and boost conversions.
![[Guides] [Mobile Analytics] [Mobile App Analytics] Zone example](http://images.ctfassets.net/gwbpo1m641r7/6l428iIEoLJFAyfKDG5lIG/e57e59b5fb6cc93492c50f34b178e7f5/zonescreenshot.png?w=1280&q=85&fit=scale&fm=avif)
Contentsquare zone-based heatmaps visualize user interactions.
If your focus is in digital marketing and conversion rate optimization (CRO), then you'll know that user tracking tools like GA will only show you conversion metrics like exit and bounce rates without explaining why.
Contentsquare's Journey Analysis capability, on the other hand, gives you the data and provides an explanation—all without you having to switch between multiple platforms.
You'll be able to investigate ongoing drop-offs by tracking the steps that led to that moment or dive deeper into how rage clicks are affecting your conversion funnel.
See how users behave with session recordings
Heatmaps are great for showing you the overall user experience on any single page, but you'll get richer qualitative insight by looking at how individual users experience your site across several pages. And for that, you'll need session recordings.
Session recordings (also known as session replays) are renderings of real user actions as they browse a website. Recordings show mouse movement, clicks, taps, and scrolling across multiple web pages on desktop and mobile.
![[visual] Contentsquare session recordings flagged with errors](http://images.ctfassets.net/gwbpo1m641r7/6VsazDS6gNeKQK5WYyPVf4/dd6f29bdf22c0d0c473723d87c8232fe/Session_Recording.png?w=943&q=85&fit=scale&fm=avif)
Contentsquare's Session Replay capability showing behavior like rage clicks and errors during user sessions.
Here's how to view session recordings on your site with Contentsquare's Session Replay capability in a couple of steps. If you're not already a Contentsquare customer, request a demo and add the tracking code to your site.
Contentsquare is designed to help you understand user behavior, not collect sensitive data. That's why our session recordings are GDPR-compliant, don't collect unnecessary information like IP addresses, and suppress all keystroke data (Ex: anything a user types in) by default. Read more about Contentsquare's privacy policy.
1. Activate Session Replay on your site
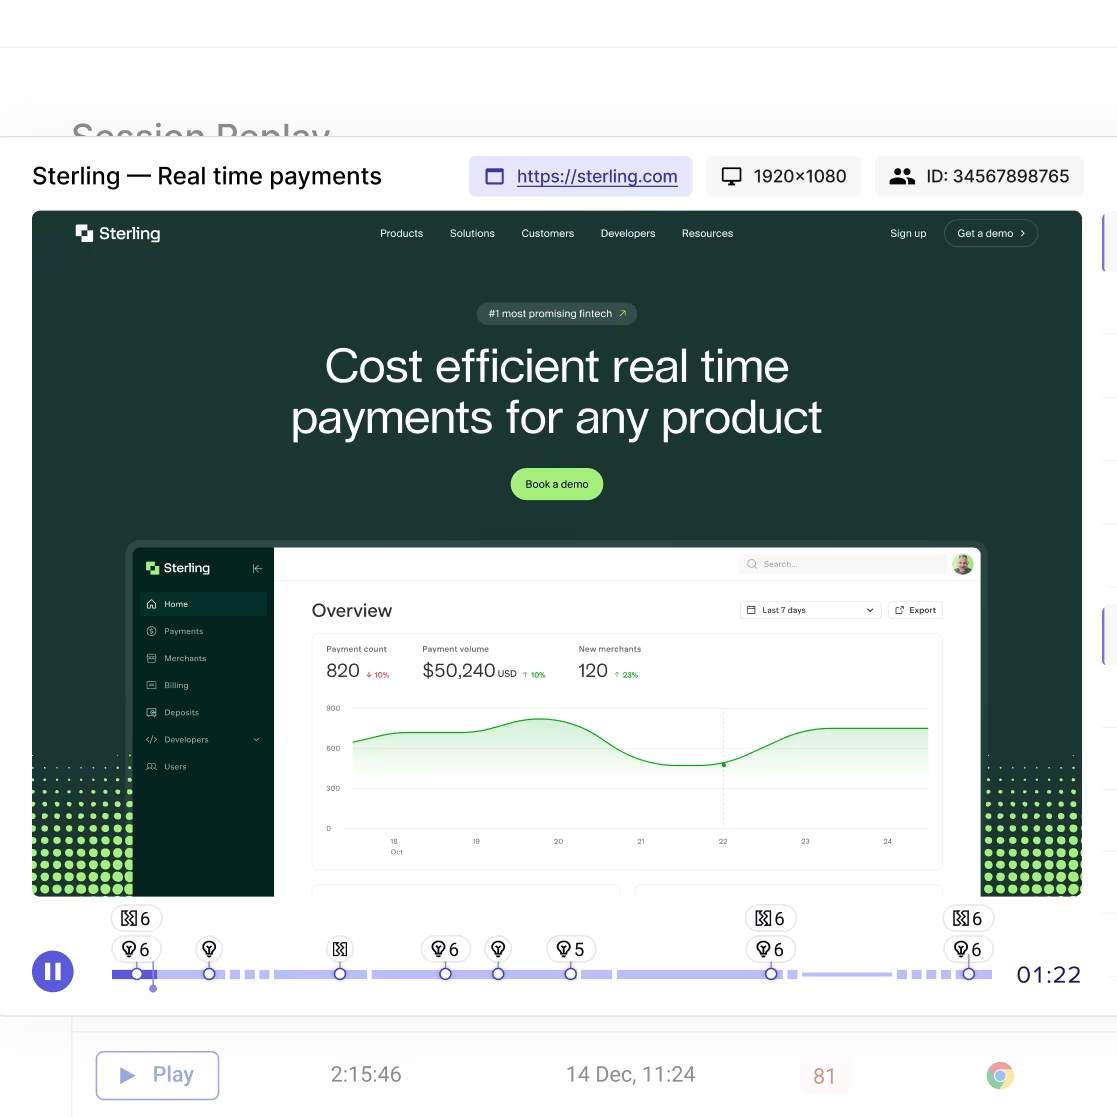
Contentsquare's Session Replay capability.
Verify that session capture is enabled by clicking on the traffic coverage widget in the top-right corner of the dashboard then select 'Session Replay' in the left column.
Once Contentsquare detects traffic on your site, new recordings will appear automatically on your Session Replay List page.
2. Start filtering
After one easy step, you're now tracking user session activity. Next, try playing around with the filter feature to narrow down the list of recordings to the ones most valuable to your user activity tracking goal.
![[Visual] session replay Filters](http://images.ctfassets.net/gwbpo1m641r7/eQ0kuqBPHQJ8JExih8tRF/5ddec6fb37a67f678758b3d82931d632/Hotjar-Recordings-Filters__1_.png?w=1038&q=85&fit=scale&fm=avif)
Contentsquare's Session Replay filters
You can filter by criteria like geographic region, separate returning users from new users, or even single out rage clicks you spotted on a heatmap.
Pro tip: if you’re using Optimizely for A/B testing, you can automatically filter Contentsquare session recordings by Experiment ID with the Optimizely integration. (This is just one of many integrations that lets you use Contentsquare with your favorite web apps).
![[Visual] Contentsquare-Optimizely-partnership Experimentation cycle](http://images.ctfassets.net/gwbpo1m641r7/756HQEAwnfyi0yH9S3KmTU/bd171c6c7a14cf000644ccc8db425243/Contentsquare-Optimizely-partnership__1_.png?w=1280&q=85&fit=scale&fm=avif)
Use Optimizely and Contentsquare together for complete experimentation
Set Optimizely experiments as events and use them as filters in Contentsquare with the click of a button. In Contentsquare's Session Replay dashboard, go to Add Filter > Google Optimize and paste/select the relevant Experiment ID.
With the Optimizely integration with Contentsquare, we're able to be more effective as a CRO program because we can take a losing test and see why it lost—maybe there's points of friction or a minor tweak that could be made to change the outcome of the test. With Contentsquare we're able to build and iterate the losing test, instead of scrapping it and starting out a square one, turning a losing test into a winning experience.
3. Review your replays
The final and most important step is to watch and analyze your session replays (popcorn optional, but highly recommended).
We've written a detailed guide to user recording analysis that will help you save time and get maximum insight from your recordings.
Pro tip: Contentsquare allows you to toggle effortlessly between the big picture insights from heatmaps and the granular detail that individual session replays offer.
For example, if you spot a user clicking on something unexpected during a replay, jump to that page's heatmap to see how common the behavior is and determine if you need to switch up the page design, or do it all in reverse by zooming in to a replay from a heatmap.
And if you don't have time to watch hundreds of recordings manually, Contentsquare's AI, Sense, does the heavy lifting for you. Sense summarizes session replays in seconds, surfacing key behaviors, user frustrations, and journey details across single or multiple sessions, so you can get to the insight without sitting through every replay. You can even shortcut directly to the most important moments, helping you spot patterns and prioritize fixes faster.
![[Visual] Heatmaps-and-session-replay](http://images.ctfassets.net/gwbpo1m641r7/2wP0r89VqXCSVVWgECyeKy/d5935f3ffda59562270b251885bf1dd6/Heatmaps-and-session-replay.png?w=1280&q=85&fit=scale&fm=avif)
Contentsquare lets you jump from heatmaps to related session recordings in a single click.
Our Voice of Customer is integrated with Contentsquare. If we get feedback from customers about problems with the shipping flow for example, we can go into Session Replay and watch the sessions. The recording can show us where the API is failing X amount of times. Being able to get customer feedback and then figure out if you need to do something in less than an hour makes our prioritization efficient and makes sure it's based on data.
Combine tracking data with user feedback
Once you spot interesting behavior in heatmaps and session recordings, ask users directly why they behave that way, for example, why they're about to leave your site.
Even a single on-site survey can uncover valuable insight and drive meaningful UX improvements. With Contentsquare, you can set up surveys instantly using ready-made templates, practical examples, and a library of survey questions to help you ask the right things.
💡 Pro tip: Short on time? Contentsquare's Sense can create a survey for any goal in seconds, then automatically generate a summary report with a suggested action plan, so you spend less time on setup and more time acting on insights.
Privacy and compliance for website tracking
Website user tracking is legal, but data privacy regulations like GDPR in Europe and CCPA in the US set strict rules for how you collect and use visitor tracking data.
Here are five things you need to know to stay compliant:
Obtain consent before tracking: display a clear cookie consent banner that lets users opt in or out of tracking before any data collection begins
Use first-party tracking: first-party cookies (set by your own domain) are more privacy-friendly than third-party cookies, which track users across multiple websites
Mask sensitive data automatically: choose tools that suppress personally identifiable information (PII) like names, email addresses, and payment details by default
Provide data access and deletion: users have the right to request access to their data and ask for it to be deleted
Document your practices: maintain a clear privacy policy that explains what data you collect, why, and how long you retain it
Contentsquare's Session Replay is designed with privacy compliance in mind. It automatically suppresses keystroke data, doesn't collect IP addresses, and masks sensitive form fields by default, so you can understand user behavior without capturing personal information.
FAQs about tracking user activity
User activity tracking is the process of monitoring, collecting, and analyzing visitor browsing behavior on a website or app. It includes tracking metrics like pageviews, clicks, scroll depth, and session duration to understand how users interact with your digital properties.
![[Visual] Contentsquare's Content Team](http://images.ctfassets.net/gwbpo1m641r7/3IVEUbRzFIoC9mf5EJ2qHY/f25ccd2131dfd63f5c63b5b92cc4ba20/Copy_of_Copy_of_BLOG-icp-8117438.jpeg?w=946&q=85&fit=scale&fm=avif)
![[Guide] [Qualitative data analysis] examples - cover](http://images.ctfassets.net/gwbpo1m641r7/2aVZklXfQk7858YbiQvuqV/ad1f67aefdf3dcf6227e363d0dee5c7f/AdobeStock_512827928.jpeg?w=624&q=85&fit=scale&fm=avif)
![[Guide] [Behavior analytics] Tools > cover image](http://images.ctfassets.net/gwbpo1m641r7/4qSFHdTBRIg5QpJYMRC1Ls/fe5620b050f9b75c1e15fd3b98d6a5f8/3467644.jpg?w=624&q=85&fit=scale&fm=avif)