
Website analysis is an essential part of ensuring your site is efficient, competitive, and valuable for your users. But knowing which tools to use can be confusing.
Often used interchangeably with 'website analytics', website analysis goes beyond traditional web and behavior analytics to include more holistic analyses that focus on customer feedback, search engine optimization (SEO), online reviews, and competitor analysis.
We consulted website owners, growth strategists, marketers, SEO and ecommerce managers, designers, and content creators to find out which website analysis tools they couldn't live without.
Here's a round-up of their recommended tools and how to use them.
Key takeaways
Website analysis tools help you understand user behavior, identify technical issues, and improve conversions through data-driven insights
The best tool depends on your primary goal: traffic analytics (Google Analytics), user behavior (Contentsquare), SEO (Semrush), or performance testing (GTmetrix)
Many tools offer free tiers or trials, so you can test before committing to paid plans
Combining quantitative analytics with qualitative behavior tools provides the most complete picture of your website's performance
Website analysis tools comparison
Tool | Best for | Free tier | Key features | Pricing tier |
|---|---|---|---|---|
Google Analytics | Traffic and conversion tracking | Yes | Traffic metrics, user paths, Google integrations | Free |
Matomo | Privacy-focused analytics | Yes (self-hosted) | Data ownership, cookieless tracking, GDPR compliance | Free - Mid |
Contentsquare | User behavior and experience intelligence | Trial | Heatmaps, session replay, AI insights, journey analysis | Mid - Enterprise |
Mixpanel | Product analytics and retention | Yes | Event tracking, funnel analysis, cohort analysis | Free - Enterprise |
Woopra | Customer journey analytics | Yes | Cross-channel tracking, user profiles, integrations | Free - Enterprise |
Optimizely | A/B testing and experimentation | No | A/B testing, multivariate testing, feature flags | Enterprise |
HubSpot Website Grader | Quick website audits | Yes | Performance, SEO, mobile, security scoring | Free |
Semrush | SEO analysis and optimization | Limited | Keyword research, site audits, backlink analysis | Mid - Enterprise |
SimilarWeb | Competitor analysis | Limited | Traffic estimates, industry benchmarks, market analysis | Free - Enterprise |
Chartbeat | Content performance (publishers) | No | Real-time engagement, headline testing, content analytics | Mid - Enterprise |
Tableau | Data visualization and reporting | Trial | Custom dashboards, data aggregation, visual analytics | Mid - Enterprise |
G2 | Reputation and review analysis | Yes | User reviews, buyer intent, competitor comparisons | Free - Mid |
The 12 best website analysis tools
1. Google Analytics
![[Visual] GA4 dashboard](http://images.ctfassets.net/gwbpo1m641r7/69rdcAGAr4xGWPefCnUPDm/54517e878976fdd6cfc1b56fe5b87d5e/GA4_dashboard.png?w=1280&q=85&fit=scale&fm=avif)
Google Analytics GA4 dashboard
What it is: without needing much introduction, Google Analytics (GA) is the tried-and-true website analytics tool that continually earns a spot on most web analysis lists.
It tracks key metrics that factor into the quantitative data analysis of a website. Traditionally known for monitoring data like website traffic, page views, sessions, user engagement, conversion, and retention, it's latest version—GA4—includes more insight into how visitors use a site.
Pros
Collect website traffic data to follow the path your new and returning website visitors take, including how they land on your site, so you can make sure the user journey runs smoothly
Track a web page's exit rate or bounce rate to get a sense of user engagement and understand where along the journey conversion rates drop
Integrate GA with other Google Marketing Platform tools, like Adwords or Google Search Console, and access all your analysis data in one platform
Free to use with robust features for most businesses
Industry-standard reporting that stakeholders understand
Cons:
Steep learning curve for GA4's new interface and event-based model
Limited insight into why users behave the way they do
Data sampling can occur at high traffic volumes
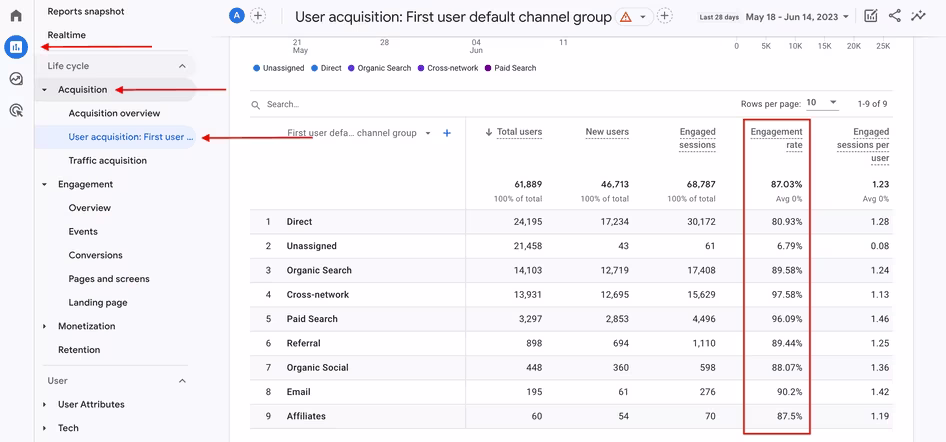
Google Merchandise Shop’'s user acquisition report table in GA4, including engagement rate
Similar alternatives:
To get the most out of your analytics, use the Contentsquare and Google Analytics integration to complement GA’'s quantitative data with qualitative user behavior tools and unlock more comprehensive insights.
"We use Contentsquare daily to monitor asset performance and make changes to our site. It would be challenging if we were completely dependent on Google Analytics or any other analytical tool."
– Mohammed Zeeshan, User Experience Manager at BFL Group
2. Matomo (formerly Piwik)
![[Visual] matomo-analytics-dashboard](http://images.ctfassets.net/gwbpo1m641r7/7FwFzI9slAPF3bbt1Woop3/14b69ef40377e544c7639affc5b9614a/matomo-analytics-dashboard.width-750.png?w=716&q=85&fit=scale&fm=avif)
Matomo analytics dashboard
What it is: if you’re looking for a website analysis software or web traffic analytics tool that puts data privacy first, Matomo is an attractive option.
This comprehensive web analytics platform is open-source and offers users 100% data ownership, while still providing all the standard web analytics data features, from unsampled traffic metrics and paid ads performance, to event tracking and user behavior data.
Pros:
Make sure your website is compliant with data privacy laws like GDPR, HIPAA, CCPA, LGPD, and PECR, so you can continue reaching users around the world
Avoid cookie consent banners with cookieless tracking that provides accurate web traffic data and user experience insights without collecting personal information like IP address—no opt-in necessary
Full data ownership with self-hosted or cloud options
No data sampling, even at high traffic volumes
Strong privacy compliance out of the box
Cons:
Self-hosted version requires technical setup and maintenance
Smaller ecosystem of integrations compared to Google Analytics
Premium features require paid plans
Similar alternatives:
3. Contentsquare
![[Visual] Monitoring](http://images.ctfassets.net/gwbpo1m641r7/5Zf9wFFwTUfQJU17tl2lhe/131e94f5d4f85714711e7afa2c092431/Monitoring.png?w=1280&q=85&fit=scale&fm=avif)
Contentsquare's dashboard
What it is: as an experience intelligence platform centered around user behavior insights, Contentsquare offers web analytics as part of its Product Analytics (PA) product.
With all tools connected in one streamlined platform, there's no need to settle for just one: you can observe how users interact with your site, analyze customer journeys, gather in-the-moment feedback, and conduct 1:1 interviews with Voice-of-Customer (VoC) features.
Each capability is designed to help you understand and improve the user experience with real-time data that's straightforward and visually engaging.
Pros:
See where users click, move, linger, and scroll through your site with the Heatmaps capability—you can even visualize how users engage with specific page elements
Gather valuable user insights with feedback widgets and on-site surveys, and save time with Contentsquare's AI, Sense, which generates goal-oriented surveys and conducts automated qualitative data analysis in seconds
Use Session Replay to watch how users interact with your site so you can uncover pain points and bugs.
Error Analysis alerts you to spikes in error occurrences like JavaScript console errors and lets you watch related sessions immediately—if you spot a problem in one session, zoom out to view broader trends and solve issues faster with the platform's Jira integration
Ask analytics questions in natural language with Sense Analyst, which generates charts and provides explanations—reducing the time from question to insight
Cons:
Enterprise pricing may not suit very small businesses
Full feature set requires onboarding to maximize value
Similar alternatives:
FullStory
Crazy Egg
Amplitude
"Contentsquare's unique UX analytics metrics are invaluable for drilling into page-specific behaviors and allowing us to surface actionable insights. We can understand how particular UX behaviors and blockers are impacting consumers on our site and pick the tests that are going to do the most good rather than the ones we think will make the most value."
– Craig Harris, former Head of Performance Analytics at Clarks
4. Mixpanel
![[Visual] Mixpanel dashboard](http://images.ctfassets.net/gwbpo1m641r7/65JCbKFDqI6SEg0JO367Ea/9bd6e96c7a8ed99d4e0fb20f230255e8/01_-_Mixpanel__is_a_favorite_product_planning_tool_for_understanding_user_behavior.jpeg?w=946&q=85&fit=scale&fm=avif)
Mixpanel's dashboard
What it is: product analytics platform Mixpanel provides an advanced, self-serve approach to user behavior analytics by using event-based tracking like conversion, engagement, and retention performance metrics.
It's designed to help ecommerce websites improve the user experience and maximize conversions by answering questions like 'Where along the funnel do users drop off?' and 'Which user cohorts convert best?'.
Conduct funnel analysis to visualize where visitors convert or drop off at each step of the journey and discover what inspires them to engage
Go beyond basic user segmentation with detailed cohort analysis to establish well-defined user groups and address their specific needs individually
Increase customer retention by uncovering popular features that delight users so much they keep coming back, again and again
Cons:
Requires careful event planning and implementation
Less focus on visual behavior insights like heatmaps
Can become expensive as data volume grows
Similar alternatives:
Finteza
Kissmetrics
Google Analytics
💡 Pro tip: don't want to keep switching between platforms? Maximize insights by using Contentsquare's Product Analytics to filter and analyze session replays, heatmaps, funnels, and other key performance metrics based on specific user actions.
With Contentsquare's User Segmentation and Retention Analysis, you can gain a deeper understanding of multi-session journeys across your site. This helps you improve conversion and retention by focusing on user behavior patterns that drive loyalty.
You can also trigger event-based surveys for specific user cohorts, especially for those with lower customer lifetime value (CLTV), to gather targeted feedback and fine-tune your strategy.
5. Woopra
![[Visual] Woopra dashboard](http://images.ctfassets.net/gwbpo1m641r7/23dTpuXuANn0mG4Wf80Ayl/a78afb631d7a2157648b339b63e5bc24/Woopra.png?w=1280&q=85&fit=scale&fm=avif)
A Woopra marketing campaign funnel dashboard
What it is: Woopra lets you analyze the entire customer journey from start to finish and really understand where to improve the user experience. This platform integrates data across multiple channels and examines every single touchpoint your users come across while interacting with your site.
It also goes above and beyond traditional analytics by providing tools that cater to different teams, like sales and customer support.
Pros:
See if your marketing campaigns and product engagement features succeed at attracting users at every touchpoint (ad, email, support, SMS, live chat—you name it), so you can refine your marketing strategy, streamline sales funnels, and tailor the customer journey directly to your audience
Get a comprehensive look at the customer lifecycle with built-in user profiles that track individual activity, then run an aggregated report with People Metrics to reveal what customer experience touchpoints need tweaking
Combine all the customer data at your disposal with 50+ one-click integrations, API connections, and plugins, including Salesforce and Zendesk
Cons:
Limited visual behavior tools (no heatmaps or session replay)
Pricing can escalate with high user volumes
Steeper learning curve for advanced features
Similar alternatives:
💡 Pro tip: Contentsquare also provides an overview of the customer journey and delivers a deeper, AI-powered experience.
With advanced Journey Analysis, Session Replay, and Frustration Score, Contentsquare not only shows where users drop off but also quantifies the impact of these issues on conversions. It provides actionable insights faster and more effectively, making it a smarter choice for businesses aiming to boost conversions and improve customer experiences across all touchpoints.
![[visual] Connect funnels and replays in Contentsquare](http://images.ctfassets.net/gwbpo1m641r7/6G9ufhcPoTjLftHgK8IOQQ/6989b2d2ba6e5c97f71e7fe9b0c50f97/Connect_funnels_and_replays_in_Contentsquare___1_.png?w=1280&q=85&fit=scale&fm=avif)
Funnel Analysis helps you discover your biggest opportunities and frustrations within minutes.
6. Optimizely
![[Visual] Result of an A/B test run with Optimizely](http://images.ctfassets.net/gwbpo1m641r7/4c7ABGcvYwWfy5k0fwqmMM/8605532d9bb84057c5d44b50988f5a27/optimizely-ab-test-result__3_.png?w=750&q=85&fit=scale&fm=avif)
Optimizely's A/B test results dashboard
What it is: digital experience platform Optimizely lets you run experiments to improve the user experience of a site. With their front-end A/B testing capabilities, you can validate hypotheses about various web design elements or functional features to ensure your site works well while engaging users across multiple devices.
Optimizely also offers content management, marketing, and ecommerce products that complement their testing tools.
Pros:
Conduct A/B, multivariate, and split testing on different variations of your homepage, landing pages, and product pages to uncover what leads to higher conversion rates
Leverage the user perspective by testing their experience with new features and design elements like navigation bars, color palettes, animations, or call to action button placements
Cons:
Premium pricing puts it out of reach for smaller teams
Requires traffic volume for statistically significant results
Analytics capabilities are limited compared to dedicated tools
Similar alternatives:
💡 Pro tip: integrate Contentsquare with Optimizely to combine rich user behavior insights with powerful experimentation tools.
Use Contentsquare’'s Session Replay and Customer Journey Analysis to understand how users interact with different variations of your site, and pinpoint where they struggle. Then, run experiments in Optimizely, using these insights to refine features and optimize the digital experience in real-time, ensuring you’'re testing what matters most.
Together, these platforms remove guesswork and turn insights into immediate action.
![[Visual] Contentsquare-Optimizely-partnership Experimentation cycle](http://images.ctfassets.net/gwbpo1m641r7/756HQEAwnfyi0yH9S3KmTU/bd171c6c7a14cf000644ccc8db425243/Contentsquare-Optimizely-partnership__1_.png?w=1280&q=85&fit=scale&fm=avif)
Experimentation and experience analytics work better together
Because I'm quite a visual person, I find the visual elements probably the most powerful. The customer journey analysis is much more of a visual interpretation of the data, it’s been really complementary to the GA data
7. HubSpot Website Grader
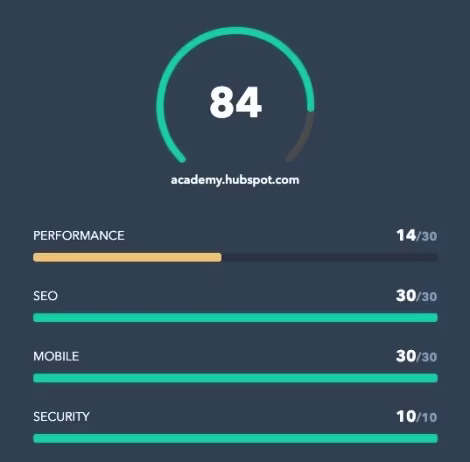
A HubSpot Website Grader rating
What it is: customer relationship management (CRM) platform HubSpot offers a free tool called Website Grader that rates sites by performance, SEO, mobile experience, and security metrics.
Needing only your site's URL and an email address, this free tool is a fast and easy way to assess your website against relevant ranking criteria and discover what areas to improve for a better user experience. HubSpot also provides other valuable business and digital marketing SEO tools to improve website SEO, including Sales Hub and Marketing Hub.
Quickly identify user experience (UX) issues and other website problems that might put off users and keep your site from performing at its best
Go from novice to expert with access to website optimization learning material, including best practice tips for digital security, mobile performance, and more
Cons:
Surface-level analysis only
Limited to one-time snapshots (no ongoing monitoring)
Recommendations are generic rather than tailored
Similar alternatives:
8. Semrush
![[Visual] Semrush SEO dashboard](http://images.ctfassets.net/gwbpo1m641r7/4nzVeIhTfbqrLugu3V3MIF/ab042a3ae50f100de002d85c532223a8/semrush-dashboard.png?w=1280&q=85&fit=scale&fm=avif)
A Semrush SEO dashboard
What it is: as one of the most reputable SEO platforms, Semrush offers various toolkits that help you improve your site's visibility using search engine results page (SERP) analysis, SEO, social media marketing, and search engine marketing (SEM, hence the name).
This involves automated analysis of keywords, search volume, backlinks, and pay-per-click (PPC) campaigns, giving you the insight you need to improve your site ranking and bring in more traffic with optimized content tailored directly to your users’' search needs.
Pros:
Conduct keyword research with the Keyword Magic tool to expertly match search intent so you can rank higher and attract more users to your site
Audit your site and uncover areas to improve with technical SEO crawler insights and on-page content optimization recommendations
Analyze your site's backlink profile and see how it compares to your competitors
Cons:
Premium pricing, especially for teams
Can be overwhelming for SEO beginners
Some data relies on estimates rather than actual figures
Similar alternatives:
9. SimilarWeb
What it is: SimilarWeb is a tool that lets you analyze your site's performance and shows how your site stacks up against competitors based on metrics such as traffic data, SEO rankings, and audience demographics.
Conducting competitor analysis with tools like SimilarWeb's DigitalRank provides the closest possible behind-the-scenes look at how well your competitors perform, revealing the user experience areas they excel at and where you might have a leg up on them.
Pros:
See how your site ranks globally, across industries, based on fluctuating traffic and engagement trends
Conduct reconnaissance by analyzing the web performance of your top competitors. You can even use SimilarWeb's browser extension to collect data while perusing the web.
Uncover new leads and impress them with a superior user experience to stay ahead of competitors
Cons:
Traffic estimates can vary in accuracy for smaller sites
Full features require enterprise pricing
Limited to competitive intelligence (no on-site behavior data)
Similar alternatives:
10. Chartbeat
What it is: if your web analysis goal is to deliver the most relevant and engaging content to your users, you'll want to turn to a content optimization tool like Chartbeat.
Not just for media brands and publishing organizations (though certainly designed with them in mind), this tool will help you evaluate your site media—from text to videos—to make sure it locks in user interest.
Pros:
Test which headlines attract the most readers, then determine which sections, recommendations, or push alerts draw their attention further
Discover how your audience connects to your content by analyzing traffic data like reader activity, page views, and average engaged minutes with the real-time Dashboard
Use the historical dashboard to get an overview of content performance, KPIs, and other valuable trends over time
Cons:
Primarily designed for publishers and media companies
Less useful for ecommerce or SaaS websites
Limited user behavior insights beyond content engagement
Similar alternatives:
💡 Pro tip: need to validate an idea before it goes live? With Contentsquare, you can easily run concept tests to gather user feedback on everything from logos to messaging. By analyzing real user interactions and behaviors, you'll be able to fine-tune your concepts based on data-driven insights, making sure they appeal to your audience and drive engagement.
11. Tableau
What it is: a lot of web analysis tools have built-in data visualization, but if you want to prepare detailed and persuasive reports, you might need a more sophisticated tool like Tableau. A subsidiary of Salesforce, this visual analytics service lets you aggregate data from multiple sources and present it in one customizable dashboard. Visualizing raw data in this way is particularly impactful when sharing key user experience insights across teams and with stakeholders.
Pros:
Tell a story with your web analysis data by creating visualizations or a detailed report that are engaging, persuasive, and easy to understand so you can get the point across to key stakeholders
Share IT and customer support metrics across teams so everyone's on the same page when it comes to delivering the best user experience possible
Create milestone-oriented dashboards and track them over time to meet company goals
Cons:
Steep learning curve for advanced features
Requires separate analytics tools for data collection
Enterprise pricing can be prohibitive
Similar alternatives:
12. G2
What it is: G2 is a platform where people can leave unfiltered user reviews about software and service companies. With this tool, you can analyze your site's reputation—and that of your competitors—to gather information on what people think about their user experience with your site.
G2 is also a key touchpoint for potential users to discover your site while they research which web analysis tools to use. You can officially claim your site's G2 profile to connect with new leads and impress them with an outstanding user experience right from the start.
Pros:
Analyze reviews from existing users and filter them to break down user experience feedback into categories like user role, topic, or geographic region
Use G2 buyer intent as a built-in prospect pipeline to funnel in prospects who are already in the mindset of purchasing a digital solution like yours
Research, manage, and budget your web analytics software stack with G2 so you can discover cutting edge tools and continue providing the best user experience possible
Cons:
Reviews can be inconsistent or outdated
Limited control over what users post
Primarily useful for B2B software companies
Similar alternatives:
How to choose the right website analysis tool
So, how do you pick the right tool for your website analysis work? Sure, trial and error will get you somewhere, but it's better to think about what you want to accomplish before you get started. Ask yourself:
Do I want to address customer churn or low conversion rates?
Do I want to determine which version of a site or app users prefer?
Do I want to make sure my site performs well, in relation to competitors?
Do I want to hear what users think about my site directly?
Do I want to dive deep into manual analysis or stick to a tool that relies on automation?
Once you figure out your goal, try out different tools to see which ones you find easy to use while providing you with the most actionable data.
Many teams find that combining tools delivers the best results. For example, you might use Google Analytics for traffic data and Contentsquare for understanding why users behave the way they do—eliminating the need to switch between multiple platforms when you need both quantitative metrics and qualitative behavior insights.
Finally, keep in mind that along with evaluating a site's functionality and usability, website analysis has everything to do with the user experience—where it currently stands and how it can be improved. When it comes down to it, approaching web analysis from a user-centric perspective is essential for maintaining a site that works well and delights your users.
Improve user experience with confidence
Harness the power of Contentsquare's website analysis tools to understand how people use your site and learn how to improve their digital experience.
FAQs on website analysis tools
Website analysis is the process of evaluating your site's performance , user behavior , and technical health to identify improvement opportunities. It goes beyond basic traffic metrics to include SEO audits , user experience assessments, competitor benchmarking, and customer feedback analysis. The goal is to understand how your site performs and where you can make changes to better serve your users.
![[Visual] Contentsquare's Content Team](http://images.ctfassets.net/gwbpo1m641r7/3IVEUbRzFIoC9mf5EJ2qHY/f25ccd2131dfd63f5c63b5b92cc4ba20/Copy_of_Copy_of_BLOG-icp-8117438.jpeg?w=946&q=85&fit=scale&fm=avif)
![[Guide] [Qualitative data analysis] methods - cover](http://images.ctfassets.net/gwbpo1m641r7/65Jwg78wpXeaUrZXJUQWSF/4ac44709e393fb8ab3382449dacddd90/surface-8HPLpr3hebU-unsplash.jpg?w=624&q=85&fit=scale&fm=avif)