
Most product decisions are made with incomplete information. Someone has a theory about why users are dropping off. Someone else has a different theory. A meeting happens, a decision gets made, and 3 months later the feature ships and nobody really knows if it moved the needle.
Product analytics tools exist to replace that cycle with something more useful: actual evidence about how people use what you've built. What they click, where they stop, what they never find, and what keeps them coming back.
Below, we've curated our list of the top product analytics tools every product team needs to know about. Keep reading to see which ones made the cut and why, so you can build your ultimate product analytics tech stack and create more customer-centric product experiences at every stage of the user journey.
Key takeaways
The right product analytics tool depends on your biggest gap, not the longest feature list. Start there
Manual event tagging gives you control but costs engineering time. Automatic capture means you never miss an interaction and your team can move faster
Quantitative data tells you what happened. Behavioral data tells you how. Feedback tells you why. The tools that connect all 3 consistently outperform those that only answer one question
Most tools in this list integrate with each other. The real question isn't which one to pick, it's which combination closes the gaps in your current stack
Product analytics tools comparison table
Tool | Best for | Key features | Pricing | Free tier |
|---|---|---|---|---|
Contentsquare | Cross-session journey analysis, enterprise teams | Auto-capture, journey analysis, session replay, AI insights | Custom pricing | Yes |
Mixpanel | Granular event tracking, campaign analysis | Event tracking, funnel analysis, cohort analysis | From $28/month | Yes (limited) |
Amplitude | Deep behavioral analysis, experimentation | Event analytics, experimentation, CDP | From $49/month | Yes (limited) |
Fullstory | Session replay, mobile apps | Session replay, heatmaps, friction signals | Custom pricing | Yes (limited) |
Pendo | SaaS teams needing in-app guidance | Analytics, in-app guides, feedback | Custom pricing | Yes (limited) |
Google Analytics | Free web analytics, Google ecosystem | Real-time tracking, attribution, ML insights | Free | Yes (full) |
PostHog | Developer-centric teams, open-source | Event tracking, session replay, feature flags | From $0 | Yes |
LogRocket | Frontend debugging, engineering teams | Session replay, error tracking, performance monitoring | From $99/month | Yes (limited) |
Optimizely | Experimentation, personalization | A/B testing, personalization, feature flags | Custom pricing | No |
9 best product analytics tools
These 9 product analytics tools, software, platforms, and solutions offer a full spectrum of features to improve your product and integrate seamlessly with other tools in your tech stack to provide more comprehensive, powerful data. We evaluated each tool on data capture method, analysis capabilities, integrations, and pricing.
Choose the ones that will help your product team get the insights they need—and build products your customers love.
1. Contentsquare
Contentsquare is an all-in-one experience intelligence platform that gives product teams a complete view of how users behave across websites, apps, and digital touchpoints. It automatically captures behavioral data without manual tagging and connects quantitative metrics to qualitative context, helping teams spend less time assembling data and more time acting on it.
Best for: product and UX teams that need behavioral data, friction detection, and business impact analysis in one place without stitching together multiple tools.
Key features:
Session Replay: watch real user sessions to understand exactly where people struggle, hesitate, or abandon a flow before completing it
Heatmaps: see which product elements get attention, which get ignored, and which are generating frustration through rage clicks and dead clicks
Journey Analysis: map the paths users actually take through your product, including the unexpected ones that reveal navigation gaps and unintended flows
Funnels: identify exactly where users drop off in onboarding, activation, and conversion flows, and quantify how much each drop-off costs
Impact Quantification: attach revenue figures to friction points so product teams can prioritize fixes based on business impact rather than frequency alone
Error Analysis: surface JavaScript errors and technical issues alongside behavioral data to distinguish product UX problems from technical ones that need engineering attention
Data Connect: export enriched behavioral data to Snowflake, BigQuery, or Databricks to combine product analytics with data from other sources in your stack
Sense: Contentsquare's AI layer that runs across the entire platform, automatically summarizing session replays, surfacing behavioral patterns, and connecting insights across heatmaps, journeys, and funnels so product teams get a coherent picture without jumping between tools or manually piecing data together
💡 Pro tip: for deeper investigations, Contentsquare's Sense Analyst takes it further by running multi-step analysis autonomously. Tell it to analyze your onboarding flow, identify drop-offs, and recommend fixes, and it runs every analysis in parallel and delivers a structured answer, without you having to ask each question individually.
![[Visual] Sense Analyst](http://images.ctfassets.net/gwbpo1m641r7/1AAcVk3qJlxWQOMTacVnTS/90a222841a015bd4f33fd95af4c66cf6/image1.png?w=1280&q=85&fit=scale&fm=avif)
Sense Analyst surfaces today's most critical issues automatically, from API error spikes to performance degradation, and pairs each one with a specific recommended fix
Pricing: free plan available (up to 200k sessions/month including Session Replay, Heatmaps, and Surveys). Full platform pricing is custom.
2. Mixpanel
Mixpanel is an event-based product analytics platform built for teams that need granular visibility into how users interact with specific features and flows. It excels at cohort analysis and campaign-level tracking, making it a strong choice for teams running frequent product experiments with many discrete user actions.
Best for: teams focused on granular event tracking, cohort analysis, and campaign performance
Key features:
Event tracking: captures specific user actions like clicks, signups, and feature usage to reveal engagement trends across your product
Funnel analysis: tracks user progression through multi-step flows and surfaces exactly where drop-offs occur
Cohort analysis: groups users by behavior or attributes to compare retention, conversion, and engagement across different segments
A/B testing: runs experiments to compare feature variations and measure which version drives better outcomes
Pricing: free tier up to 20M events/month. Growth plan from $28/month.
💡 Pro tip: Mixpanel tells you which A/B test variant won on conversion. Use Contentsquare's Session Replay filtered by experiment cohort to watch how users in each variant actually behaved, so the winning result becomes a replicable insight rather than just a number you move on from.
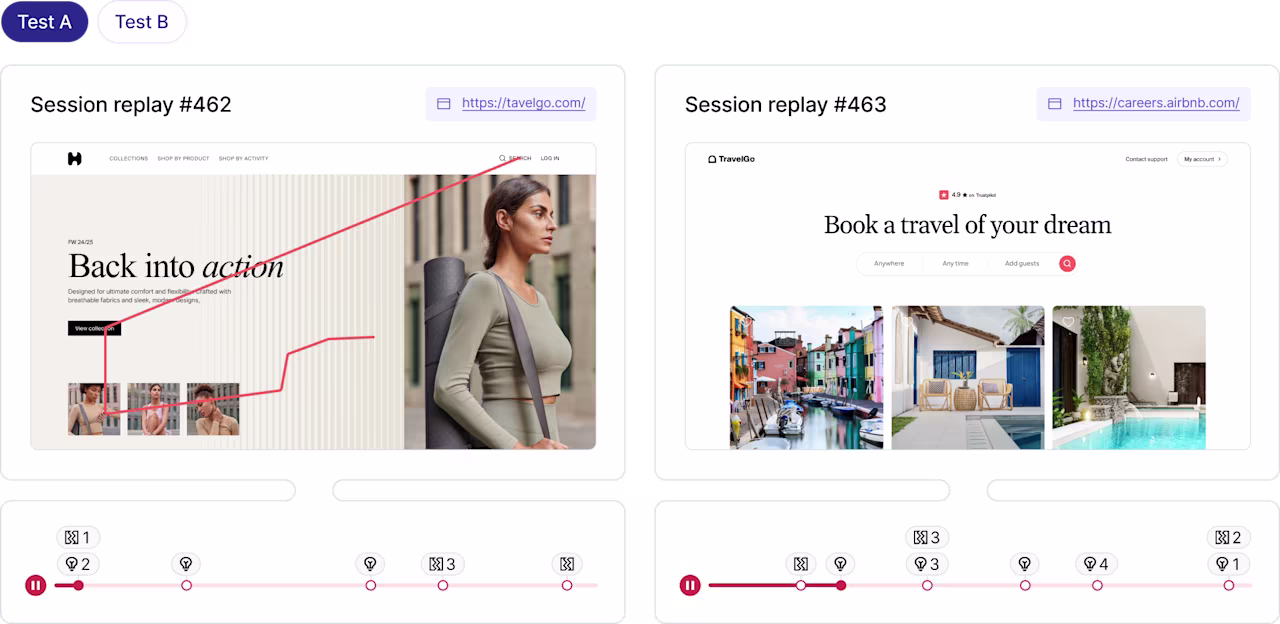
Watch session replays from each A/B test variant side by side in Contentsquare to understand the behavioral difference behind the conversion result, not just which variant won
3. Amplitude
Amplitude is a behavioral analytics platform that combines deep event analysis with a built-in experimentation engine. It's designed for product teams that need to run data-driven experiments, build predictive models, and connect behavioral insights to a central customer data platform. Because it relies on manual event tagging, implementation requires ongoing engineering resources to set up and maintain as your product evolves.
Best for: product teams needing deep behavioral analysis paired with a built-in experimentation platform
Key features:
Behavioral analytics: analyzes feature usage, retention, and engagement patterns across user cohorts with detailed segmentation
Experimentation: plans, delivers, and analyzes product experiments with statistical rigor built into the workflow
Customer data platform: centralizes user data from multiple sources for consistent identity resolution across tools
Predictive insights: uses machine learning to surface users at risk of churning or likely to convert
Pricing: free tier available. Growth plan from $49/month. Enterprise pricing is custom.
💡Pro tip: the trade-off between automatic and manual data capture is significant. Automatic capture (like Contentsquare's Smart Capture) eliminates engineering overhead and ensures you never miss important interactions. Manual tagging gives you more control but requires upfront planning and ongoing maintenance.
![[Visual] Masthead - Smart Capture](http://images.ctfassets.net/gwbpo1m641r7/5wpuCiQ2DbXESrpwLkPKM4/fb1467f08ead1312faca74f5585b9673/Frame_1948759855__1_.png?w=1280&q=85&fit=scale&fm=avif)
Contentsquare's Smart Capture records every user interaction automatically in real time, so product teams have complete behavioral data from day one without waiting for engineering to tag events
4. Fullstory
Fullstory is a digital experience platform that automatically captures user sessions across web and mobile without manual tagging. It uses machine learning to surface friction signals and is particularly well suited to teams where most user activity happens on apps or ecommerce properties.
Best for: teams prioritizing automatic session capture and mobile app analytics
Key features:
Session replay: records mouse movements, clicks, scrolls, and keystrokes automatically across devices and browsers
Conversion funnels: tracks progression through key flows and surfaces where users abandon
Heatmaps: visualizes click and engagement patterns across pages
Friction signals: detects rage clicks, error clicks, and thrash clicks using ML without requiring manual event definitions
Pricing: custom pricing. Free tier available with limited sessions.
💡 Pro tip: use Contentsquare's Frustration Score to go beyond detecting rage clicks and error clicks. Sense takes it one step further and automatically quantifies the business impact behind each frustration signal, showing impacted traffic, lost conversions, and missed revenue, then surfaces AI-powered session summaries of the worst sessions so you know exactly what happened and what it's costing you.
![[Visual] Rage clicks](http://images.ctfassets.net/gwbpo1m641r7/4Pq9iLl1o4oFPFyqUdrCed/a38f3e461ca77264c698318b54c869ab/Screenshot_2024-12-04_at_13.30.20.png?w=1280&q=85&fit=scale&fm=avif)
Contentsquare automatically surfaces rage click signals with impacted traffic, lost conversions, and missed revenue quantified
5. Pendo
Pendo combines product analytics with in-app guidance, letting teams both measure how users engage with features and intervene directly with tooltips, walkthroughs, and messages. It's built for SaaS teams where feature adoption and user onboarding are the primary growth levers.
Best for: SaaS product teams that need in-app guidance and onboarding alongside analytics
Key features:
In-app guides: delivers personalized onboarding flows, tooltips, and feature walkthroughs without engineering involvement
Feature analytics: tracks which features are used, by whom, and how often to guide roadmap decisions
Feedback collection: gathers in-product feedback tied to specific features and user segments
Roadmap planning: connects user feedback and usage data to product planning workflows
Pricing: custom pricing. Free tier available up to 500 monthly active users.
6. Google Analytics (GA4)
Google Analytics is a web analytics platform that tracks traffic, attribution, and user behavior across websites and apps. GA4 introduced event-based tracking, more flexible data streams, and codeless setup, making it a stronger option for product teams than its predecessor, while remaining completely free.
Best for: teams needing free, robust web analytics with deep Google ecosystem integration
Key features:
Real-time tracking: monitors active users, traffic sources, and conversions as they happen
Attribution modeling: connects traffic sources to conversions across multiple touchpoints
Predictive insights: uses machine learning to surface purchase probability and churn likelihood
Codeless event tracking: captures clicks, scrolls, and form submissions without engineer involvement for common interactions
Pricing: free. Google Analytics 360 (enterprise) has custom pricing.
💡 Pro tip: GA4's engagement metrics tell you whether users stayed but not whether they found what they came for. Contentsquare Surveys can be triggered at the exact moment users are about to leave. Use them to capture intent data that GA4's behavioral signals can't surface on their own.
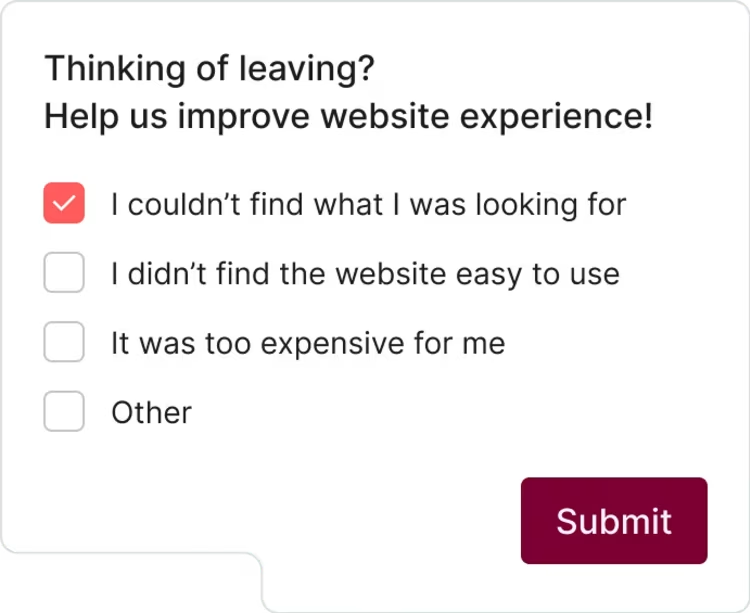
Contentsquare Surveys triggered on exit intent capture the reason users are leaving in real time
7. PostHog
PostHog is an open-source product analytics platform built for engineering-led teams that want full control over their data and infrastructure. It combines event tracking, session replay, and feature flags in a single tool, with the option to self-host for teams with strict data residency requirements.
Best for: developer-centric teams wanting open-source flexibility, self-hosting, and feature flag capabilities
Key features:
Autocapture: tracks clicks, pageviews, and interactions automatically, with custom events available for specific tracking needs
Feature flags: rolls out features to specific user segments and ties flag state directly to analytics data
Session replay: records user sessions with full context, including console logs and network requests
Data warehouse integration: exports product data directly to Snowflake, BigQuery, or Redshift
Pricing: free tier includes 1M events and 5K session recordings/month. Paid plans are usage-based.
💡 Pro tip: use Contentsquare's Data Connect to export enriched behavioral segments directly to your warehouse. Then use Sense to ask plain-language questions across that combined dataset without writing a single query, so your data team gets the depth and your product team gets the speed.
![[Visual] sense analyst](http://images.ctfassets.net/gwbpo1m641r7/37XNlV8MKCKNLP6BBYfak3/9ec5cdbe760568418abc528b9b273caa/sense_analyst.png?w=1280&q=85&fit=scale&fm=avif)
Ask Sense Analyst which features users struggle with most after onboarding and it runs the full analysis autonomously, comparing page performance, device type, and user journeys without a single manual query.
8. LogRocket
LogRocket bridges product analytics and frontend engineering by combining session replay with error tracking and performance monitoring. When a user hits a problem, teams can watch the session with full technical context, including network requests, console logs, and JavaScript errors, to diagnose and fix issues faster.
Best for: engineering teams debugging frontend issues and monitoring the performance impact on user experience
Key features:
Session replay with technical context: records user sessions alongside network requests, console logs, and Redux state for complete debugging context
Error tracking: captures JavaScript errors automatically and surfaces them with full session context
Performance monitoring: tracks page load times, input latency, and rendering issues and correlates them with user behavior
User analytics: combines technical monitoring with product metrics like conversion and retention
Pricing: free tier available. Team plan from $99/month.
9. Optimizely
Optimizely is a digital experience platform built around experimentation and personalization. It lets teams run A/B tests, multivariate experiments, and feature rollouts across web and mobile, with strong segmentation tools to deliver different experiences to different audience groups.
Best for: teams running frequent experiments and needing advanced personalization alongside testing
Key features:
A/B and multivariate testing: runs experiments across web and mobile with statistical significance built into reporting
Personalization: delivers customized experiences to user segments based on behavioral and attribute data
Feature flags: controls rollouts and targets new features to specific user groups
Conversion rate optimization: analyzes experiment results by segment to find which audiences respond to which changes
Pricing: custom pricing.
💡Pro tip: get more impactful results from testing digital experiences with the Optimizely + Contentsquare integration.
The Optimizely-Contentsquare partnership gives you more hard numbers and context behind your A/B tests. By combining the platform's experimentation capabilities with Contentsquare’'s holistic customer behavior metrics you can
Use Contentsquare's Journey Analysis to understand how users move through your site and spot the best opportunities for A/B testing
Build and track better and fewer experiments during peak times with Optimizely's Multi-Arm Bandit (MAB) tests
Use Contentsquare's Session Replay to understand why users prefer one version over another, make better decisions, and deepen customer engagement
Understand the impact on conversion with Contentsquare's Impact Quantification and increase your revenue
Together, these tools provide key insights into your product's usability, performance, and product engagement, making it easier for your team to understand what drives your customers’' behaviors.
![[Visual] Set Optimizely X experiments as events to filter Contentsquare insights with the click of a button](http://images.ctfassets.net/gwbpo1m641r7/U0FzBf7uGkSpkpT294Kso/c542f7d6907b01f7f5b65ad375c9efcb/Screenshot_2024-10-30_at_15.56.19.png?w=1280&q=85&fit=scale&fm=avif)
Filter sessions by Optimizely A/B test variant directly in Contentsquare, so you can analyze how users in each experiment cohort actually behaved, not just whether they converted
How to choose the right product analytics tools for your team
9 tools with different strengths, price points, and technical requirements means the right answer depends entirely on what your team actually needs. Here's how to cut through it:
Start with your biggest gap. If your problem is not knowing why users drop off, you need behavioral and qualitative data. If it's shipping features nobody uses, you need event tracking and retention analysis. The tool that solves your actual problem beats the tool with the longest feature list every time
Be honest about engineering resources. Tools like Mixpanel and Amplitude are powerful but require ongoing event instrumentation. If your team can't maintain that, automatic capture tools will serve you better in practice than technically superior ones that never get fully implemented
Think about where the data needs to go. A tool that keeps insights locked in its own interface has limited value. Check whether it integrates with your data warehouse, your CRM, and the tools your team already works in daily
Don't evaluate quantitative and qualitative separately. Event data tells you what happened. Behavioral data tells you how. Feedback tells you why. The tools that connect those layers (like Contentsquare), or that integrate with ones that do (again like Contentsquare), will consistently outperform those that only answer one of the 3 questions
FAQs about product analytics tools
Product analytics tools are software and applications that examine user behavior over time within your product. They capture, analyze, and visualize crucial information about how users interact with your product across sessions and devices, which you can then use to optimize performance, diagnose problems, and correlate user activity with long-term value.
![[Visual] Contentsquare's Content Team](http://images.ctfassets.net/gwbpo1m641r7/3IVEUbRzFIoC9mf5EJ2qHY/f25ccd2131dfd63f5c63b5b92cc4ba20/Copy_of_Copy_of_BLOG-icp-8117438.jpeg?w=946&q=85&fit=scale&fm=avif)
![[visual] man and a woman in front of the laptop](http://images.ctfassets.net/gwbpo1m641r7/4MGw9yViQS4fJSNlpsrUFB/b3cc18c9886ebfad5f35ef56c0b9ef64/Magic_Stick_-_Photo_4.jpeg?w=624&q=85&fit=scale&fm=avif)
![[Visual] AI analytics home - stock](http://images.ctfassets.net/gwbpo1m641r7/64i3HakmQ9aHWYWEEqpFUM/f1d5d2a41b5c7d7a523a34b58bd50ece/AdobeStock_634961399.png?w=624&q=85&fit=scale&fm=avif)