What is behavioral analytics? Your complete guide


In the current economic climate, efficiency is the lifeline you need to survive—Digital teams, therefore, need to focus on providing the sort of frictionless experiences for new and returning loyal customers.
And that’s where behavioral analytics comes in, helping to create the holistic understanding of your digital customers—and what delights and frustrates them—that you need to ensure your customer experience is as efficient and friction-free as possible.
Businesses are catching onto the importance of achieving this holistic insight into customer behavior, with research showing more than 65% of companies will increase their spending on CX technologies, like behavior analytics, during 2023.
In this guide, we’ll deep dive into user behavior analytics, covering what it is, how it can help your digital team and why now is the right time to invest. Throughout, we’ll also provide real-life examples from leading brands and expert insights from Sam Counterman (Vice President of Brand & Growth Marketing at Contentsquare).
“Businesses need to focus on creating memorable, rich experiences for their users that’ll get them to take action and come back because they’ve had such a great experience.”
— Sam Counterman, Vice President of Brand & Growth Marketing at Contentsquare
Behavior analytics: understand your users at first
Behavioral analytics lets you understand how users navigate and interact with your website or app. It provides your teams with the insights they need to create seamless digital experiences that users actually enjoy.
This is analytics that goes beyond traditional metrics like clicks and bounce rate to reveal your users’ behavior, feelings and intent, giving you that extra layer of intelligence to understand what happens between the clicks or bounces.
Sam gives us his go-to definition of behavior analytics: “Simply put, it’s a set of both qualitative and quantitative data that give you deeper insight into how people navigate your website or app.” It couldn’t get much clearer than that!
How is behavior analytics different from traditional analytics?
Conventional analytics (like Google Analytics) only tells you half the story, whereas behavioral analytics gives you a granular, more accurate view of how and—more importantly—why users behave the way they do.
Importantly, as Sam notes, the two aren’t mutually exclusive but complement each other. “Behavioral analytics is all about unpicking the story behind the user’s behavior. The benefit of this is that you get to see the real-life scenarios behind the numbers.”
Who can benefit from behavioral analytics within an organization?
Traditionally, analytics has sat inside the marketing department. But over the last decade—thanks to digital disruption—there’s been a massive shift.
“There’s a lot more data now and with that comes different types of personas that are crunching numbers,” explains Sam. “We’re seeing new roles like Data Engineering and Data Analyst coming into the mix.”
Data is also more accessible than before, and today most digital teams can benefit from behavioral data. On a higher level, this enables digital teams to align around the same user insights, enabling data-driven decision-making across the organization.
“When you analyze something and come to a conclusion, you’ll have to make a change,” says Sam. “Whether it’s a front-end or back-end website change—you’re going to need support from other teams to make it happen.”
All digital teams can benefit from behavior analytics tools:
- eCommerce
- Product
- Operations and IT
- Design and UX
- Marketing
- Analytics

What are the benefits of behavioral analytics?
From increased site conversion and online sales to retention and customer satisfaction, user behavior data will help you reach your key digital objectives.
We’ve highlighted the three main benefits below:
1. Surface pain points and reduce user frustration
Imagine going to a grocery store, loading your basket with everything you need and going to the self-checkout… only to realize it’s broken. You’ll likely leave the store without making your purchases. (Possibly swearing never to return.)
The same goes for the digital world. If the shopping experience you as a business provide online isn’t seamless—especially at checkout—it’s going to negatively impact your conversions and revenue.
Of course, you can’t fix what you don’t know exists—and this is why behavioral analytics is a godsend for digital businesses. It will rapidly surface any user frustration and help you understand their pain points, alerting you to where they’re struggling, what’s annoying them and what’s stopping them from taking action.
2. Behavior analytics helps you understand what makes users come back for more
It’s no secret that fostering loyalty and keeping your current customers happy is crucial for your bottom line. In fact, returning customers are known to convert at a higher rate and spend 67% more than new ones.
Behavioral analytics tools allow you to segment your traffic into new vs returning visitors to reveal what makes these different types of users click, convert and come back for more.
By applying this segmentation, you can grasp what pieces of content your visitors (depending on the segment they belong to) engage with the most, and what content or products are driving conversion to help you prioritize your digital strategy.
3. Understand the ‘why’ to operate leaner
Unlike traditional tools that measure metrics like bounce or conversion rate, behavior analytics help you decipher the ‘why’ behind key metrics.
For example, if your homepage bounce rate is high, behavior analytics tools can uncover the reason (or reasons) behind its poor performance. This insight empowers you to make confident, data-driven decisions to optimize your experience, remove points of friction, fix technical errors and make the most out of your existing site traffic.
“If you make it as easy and as simple as possible for users to meet their needs, they’re bound to come back,” says Sam. “This is where focusing on getting the basics right with the traffic you’ve already got coming in is so important. It’s all about operating leaner and converting faster.“
Behavioral analytics tools
With dozens of user behavior analytics platforms available on the market, it can be daunting to choose just one. We’ve listed the key capabilities to look out for:
- Session replay or session recordings reconstruct an individual visitor session on your website for you to playback and analyze. Recordings give you a front-row seat view into how individual users interact with your site—from clicks to hovers and swipes—and any technical errors or other obstacles they encounter.
- Heatmapping or heatmaps are data visualizations that help you see how users interact with your site or app—showing you where users are clicking and hesitating, and how far down the page they’re scrolling.
- Segmentation analysis allows you to group your audience by past or current actions and behaviors on your site or app, enabling you to make adjustments that will resonate with specific user types (and analyze the success of these adjustments on an ongoing basis).
- Voice of Customer features enable you to directly collect feedback from individual customers regarding their experience from your website or app.
- Form analysis shows you how users interact with every form field on your web forms, tracking how many press ‘submit’ —or drop off.
- Customer journey analysis allows you to measure behavior across a series of touchpoints over time to understand how these impact business performance.
Sam Counterman, who not only works at Contentsquare but also uses the platform on a daily basis, shares how his digital team uses Customer Journey Analysis to compare behavior of users in different locations. “We can easily compare the UK to the United States to see if there’s a different journey that users go on when they hit our homepage,” shares Sam. “Contentsquare allows us to quickly see the dead zones–bounce and exit rate of pages–helping us draw conclusions and understand whether we need to dig a little bit deeper into the user behavior data.”
Take a product tour Get to grips with Contentsquare fundamentals with this 6 minute product tour.
IRL behavioral analytics examples
To give you a real grasp of how behavioral analytics can be used to elevate your digital strategy, here are four examples from businesses across different industries including eCommerce, travel and hospitality, automotive and retail.
1. Increasing conversions on a key landing page (eCommerce)
Direct-to-consumer sleep brand Emma conducted an in-depth behavioral analysis of its Black Friday campaign landing page. Their goal: to understand user interaction better and get a closer look at the conversion funnel.
Emma’s digital team used Contentsquare’s Customer Journey Analysis to understand users’ onward journeys from the landing page and Zone-Based Heatmaps to gain a deeper understanding of how users were navigating and interacting on the page.
This analysis gave the team a list of adjustments to make to the page. To prioritize which changes to make first, they used Impact Quantification to predict which changes would make the biggest impact on conversions and ROI.
The changes made to the landing page layout and content (based on insights from Contentsquare) resulted in a projected 7% increase in conversions.
2. Improving the homepage customer experience (Travel)
Leading Central European railway operator Thalys wanted to ensure an efficient and smooth experience for its customers across its digital channels.
Using Zone-Based Heatmaps to understand the behavior analytics, the team analyzed homepage performance and immediately uncovered two major insights:
- The exposure rate of a commercial banner was low at just 10.6%, while the click rate was even lower at 1.10%
- There was a high click recurrence on their payment method section, highlighting a source of user frustration
Armed with these insights, the team were able to make data-driven decisions to redesign the homepage experience. These decisions resulted in (deep breath): a 500% increase in conversion rate, 265% increase in exposure rate and 49% decrease in click recurrence.
3. Creating a seamless buyer journey (Automotive)
Automotive brand ŠKODA UK wanted to encourage visitors to request a test drive by increasing the number of interactions on its Digital Toolkit, which allows prospects to visualize how their dream car might look and feel.
Behavior analytics in both Google Analytics and Contentsquare uncovered that users weren’t being provided with clear next steps when interacting with the site’s ‘new car’ pages—and were bouncing back and forth between pages and circling back on themselves as a result.
This ‘looping’ behavior appeared to indicate that visitors to ŠKODA UK’S ‘new car’ pages were confused about how to proceed and abandoned their journeys.
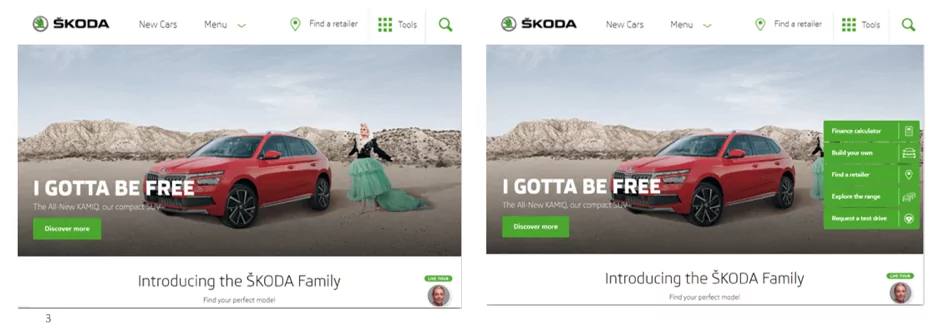
With this hypothesis in mind, the team decided to better highlight the Digital Toolkit with a ‘sticky tools’ navigation on the right side of the page, driving a +40% increase in test drive visits.
4. Reducing friction at checkout (Retail)
The digital team at Harrods used behavioral analytics to surface issues in their checkout journey and Session Reply to better understand the ‘why’ behind these issues.
During this analysis, they noticed an error in the checkout form that had impacted over 7,000 desktop visits. Something was causing customers to click on the “First name” field multiple times—behavior we call ‘rage clicking’. But what?
Session Replay revealed that the segment of customers rage-clicking had made some error or other in inputting their name and been met with a vague error message: “Please enter a valid first name”.
Unable to understand what was causing the issue (and not being provided with any clarification), customers were responding by trying to input special characters or multiple names—only to be met with reiterated requests to “Please enter a valid name”.
No wonder they were rage-clicking!
Armed with this insight, Harrod’s digital team rewrote the offending error message to be more specific and helpful: “Please enter a first name using characters A-Z, – and ‘ “.
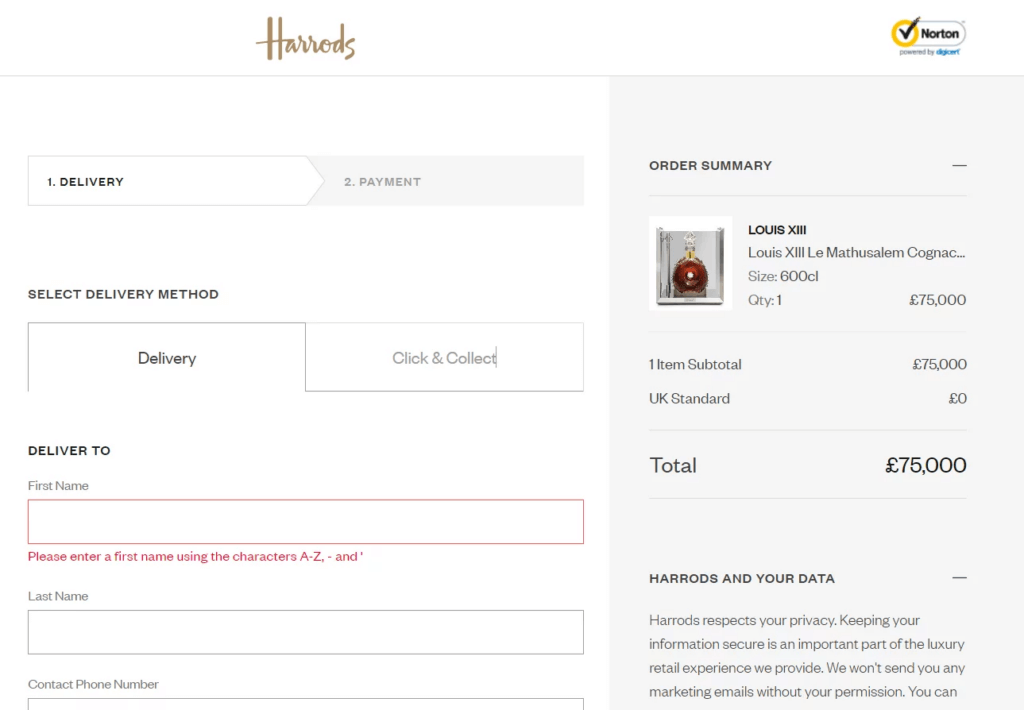
This simple change resulted in a 50% decrease in rage clicks, with the percentage of multiple clicks in the “First Name” field dropping from 16% to 8% in just over 2 months.
“Contentsquare lets you put yourself in the shoes of the user. Through capabilities like Session Replay, you get to see what they’re experiencing—and understand how they’re feeling about it. That for us is extremely powerful.” — Sam Counterman, Vice President of Brand & Growth Marketing at Contentsquare
Get started with user behavior analytics
Behavioral analytics is no longer a nice-to-have—it’s an essential tool for businesses that want to optimize their digital experiences to drive growth.
You can’t afford not to know what delights and frustrates your digital customers.
So if you want to uncover your digital customer, watch our demo or contact us to find our more.
Keep Reading...