Conversions rarely occur on a whim; usually, there is a layered process behind eCommerce purchases. Known as the conversion funnel — or the sales funnel — this model shows the conduit between the least aware prospects to those who are most aware of your company’s products and services. Those with the most knowledge of your offerings are usually the most interested and motivated to convert.
Brands have to be both wary and strategic in the ways they set up conversions, and that is where the concept of the conversion funnel comes in handy. While no one can truly “set up” conversions, you can set the scene and command all the workings that bring visitors closer to converting thanks to conversion funnel optimization.
As UX-perts, we like to blare the horns on the importance of UX, so it should come as no surprise that a good user experience plays an important role in conversion rate optimization. Let’s take a look at how you can optimize your conversion rate by way of working in a good UX to the different stages of conversion funnel optimization. Here are some of the topics we will discuss:
- What is a conversion funnel?
- What is conversion funnel optimization in marketing?
- What does good conversion funnel optimization look like?
- The different stages of the conversion funnel
- How to optimize these stages to drive consumers down the funnel
What is a conversion funnel?
Before we jump into how to optimize your conversion funnel, we need to briefly review what a conversion funnel is.
The conversion funnel denotes a process in which brands work to turn potential customers into converting customers.
It is comprised of several stages, with each one indicating your customers’ level of brand awareness, interest, and willingness to buy — along with the gradual steps and undertakings you can take to lead users further down. Here’s a quick breakdown of the different stages and what they mean:
- Attention/Awareness: At this stage, your users become aware they have a problem and first discover your brand. This might be through word of mouth, a google search, a blog post, a display ad, an email – you name it!
- Interest: Now, your users are more interested in what you have to say. Share how can your brand help them solve their problem?.
- Desire: This is where you need to turn on the charm and sell your visitors the benefits of your products and services. You want to drive home how your company is different (and better) than your competitors, pushing your users further down the funnel.
- Action: Your users have all the information they need and are ready to pull the trigger, whether they’re checking out to buy a shirt in their cart, applying for a loan, signing a contract, or taking whatever action your company defines as a conversion.
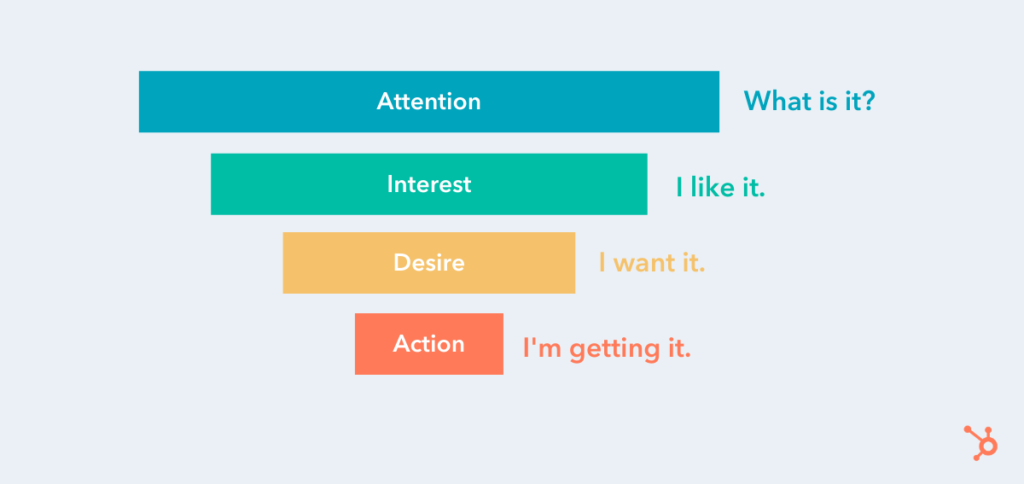
Source: HubSpot
What is Conversion Funnel Optimization in Marketing?
While the stages in each conversion funnel may differ from brand to brand, each shares the ultimate goal of “pushing” site users down to the very last step, which, evidently, represents conversions.
Through this structure, brands can group their potential customers into easy-to-understand categories, thereby dictating several efforts they can maneuver to encourage prospects further down the funnel.
There are various marketing tactics to drive customers down the conversion funnel; they can be deployed through more than one stage. Let’s dig deeper.
What is Good UX in Conversion Funnel Optimization?
Now that you know what a conversion funnel is, the next thing to cover is how to apply good UX practices that relate to each stage in the conversion funnel. The following spells out the ways brands can enhance their UX per each stage of the conversion funnel to optimize it and garner greater conversions.
Stage 1: Awareness
Sitting atop the conversion funnel as the entry point, the awareness stage is the stage with the least… awareness of your brand or offering(s). It’s also the stage with mounting awareness, as potential clients become cognizant of your business and click onto your website, the act which carries with it the possibility to spawn possible interest.
But that requires capturing new customers. You should approach your awareness stage with the mentality of casting a wide net. You want to attract as many people as you can, so you have a higher chance of moving people further down the funnel.
We’re not saying adopt a “spray and pray” method, you still need to be strategic and methodical so you can securely create a heightened awareness of what your brand does – and attract the right kind of customers. Getting tons of traffic on your site or clicks on your ads can be exciting at first, but if these are unqualified visits, they won’t do you much good.
Here are a few ways to educating potential customers on your brand and make it easier for new users to find you:
- PPC ads
- Social media campaigns
- SEO
Take e.l.f Cosmetics, for example. To educate potential customers, e.l.f. Cosmetics allows anyone to take their skincare quiz which not only provides awareness to what types of skincare products they offer but also how their products can help alleviate a consumer’s pain points. Whether a potential customer wants to treat acne, dry skin, or improve fine lines, e.l.f. has products that cater to their every need.
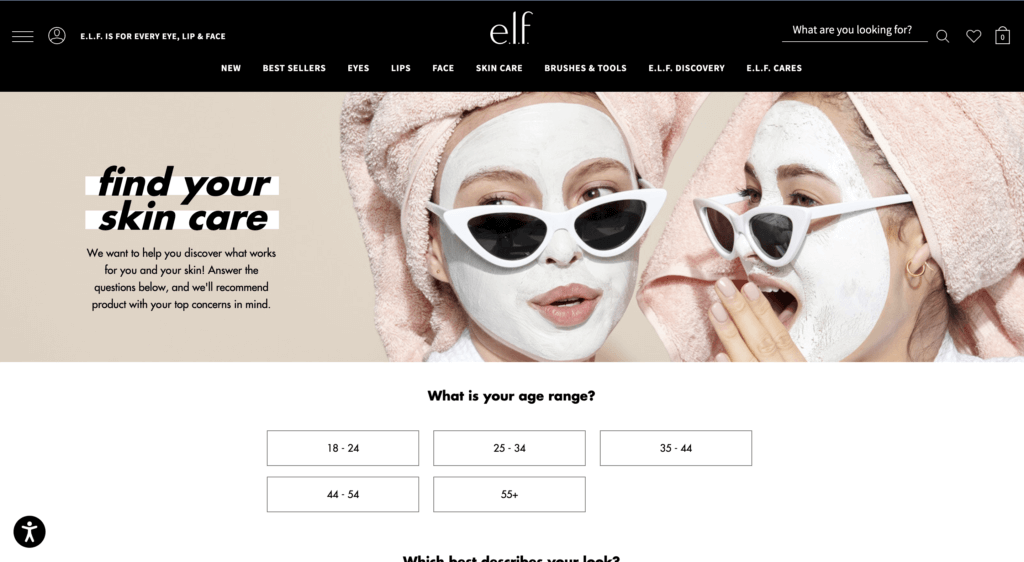
Source: e.l.f. Cosmetics website
You have to keep your target audience in mind and create your campaigns accordingly. But once you’ve brought new people onto your site, the UX must be optimized, or at least suitable to pique interest within visitors (lead them to step 2), or — even better — make them convert on the spot.
UX Best Practices at The Awareness Phase
There is a slew of general ways to improve upon the user experience. But often in the awareness stage, users usually arrive at your site via a landing page.
The UX has to be top tier on this page. Keep the copy and imagery relevant to the conversion goal, while making it clear what your brand does. The latter is more important since you’re introducing new prospects to your company. The copy and other contents on landing pages should be to the point, so steer clear of wasting users’ time. In short, don’t overload it.
Most importantly, construct the landing page so that it is relevant to the message that led visitors to click on it in the first place.
Stage 2: Interest
Next, we reach the stage of interest. Now that prospective customers know your company exists, they have to frequent your website; simply knowing about your offering(s) does not ensure they’ll return to your site or engage with your content.
Content is key in this step, as it can foster relationships and maintain interest within your prospects. There’s a twofold approach for conversion funnel optimization: the first is the nature of the content and the second concerns the UX, or the feelings and attitudes users develop over their experience.
The first element deals with the core of the content — the content type, its subject matter, how it can help with your prospects’ problems, its visual identity, etc. You would need to establish a blog with relevant posts to your industry or niche. Take Slack for example, since the pandemic Slack has upped its content production, providing guides, interviews, etc to teach business leaders and employees alike how to adapt to the “new normal” with Slack.
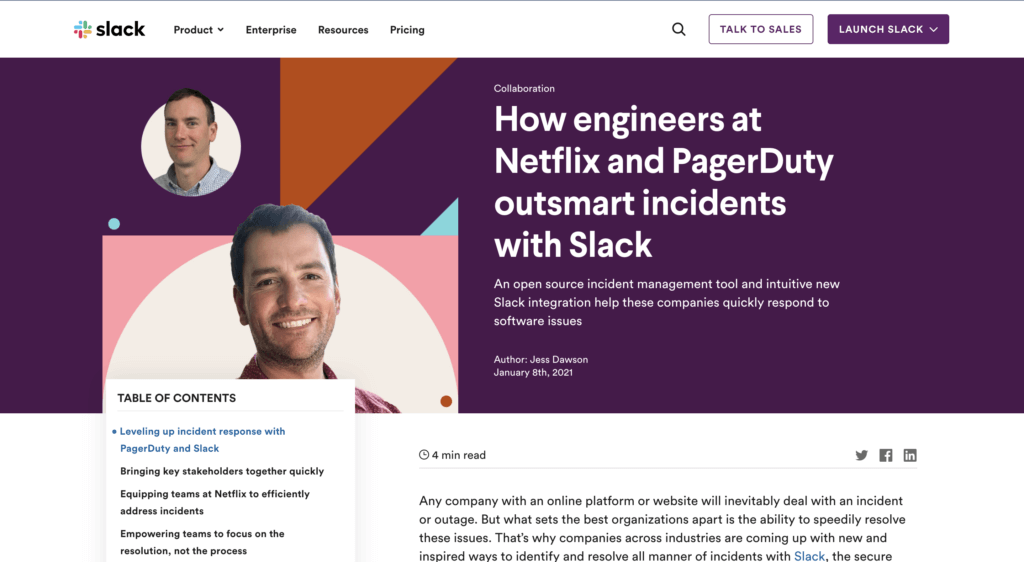
Source: Slack
Other useful content for stimulating user interest are:
- Guides
- Videos
- Interviews
- A resources page to keep everything together in one place
- And more! The sky is the limit – get creative and see what content works for your audience.
You would have to make sure these align with the needs/interests of your vertical as well as making your content stand out and offer something different. Videos and other content, for example, should not focus on the product alone, but offer something of value — whether that’s inspirational content, news related to your niche or something else.
UX Best Practices for The Interest Phase
As for the attitudes toward the content, i.e. the UX, consider the amount of content on your page; is it slowing down your site? If so, reduce it so that you never have issues with loading speeds.
Make sure everything can be easily seen and accessed. This will encourage further browsing. For example, if you have an in-page element that requires scrolling, the width of it, at the very least, needs to be wide enough so all the content can be easily read.
You should limit scrollable in-page content to one type of scrolling function (either by length or width, never both.) This is generally length, as this is easier to look through. Use carousels, in-page recommendations, and links to other pages to incite browsing.
In fact, when it comes to the UX in general, be sure to keep it continually optimized so that all content elements are easy to understand and seamless. The best way to gauge customer understanding and frustration is of course to measure interactions with each element.
Stage 3: Desire
Once you’ve developed some level of interest, you need to propel prospects towards the lower half of the conversion funnel, which starts with desire. Representing a heightened interest, desire attracts users to your actual offering aside from your content alone.
At this stage, you should make your product or service, as the stage suggests, desirable. It’s also where you have to distinguish your offering from that of your competitors, specifically, by positioning your company as the better option.
This can be done by:
- Employing more targeted social ads that lead to pages with CTAs
- Highlighting how your product can alleviate specific problems
- Offering sales/promotions
For example, Superdry entices their customers through a series of emails providing special discounts, promotions, etc. to showcase the value of their products.
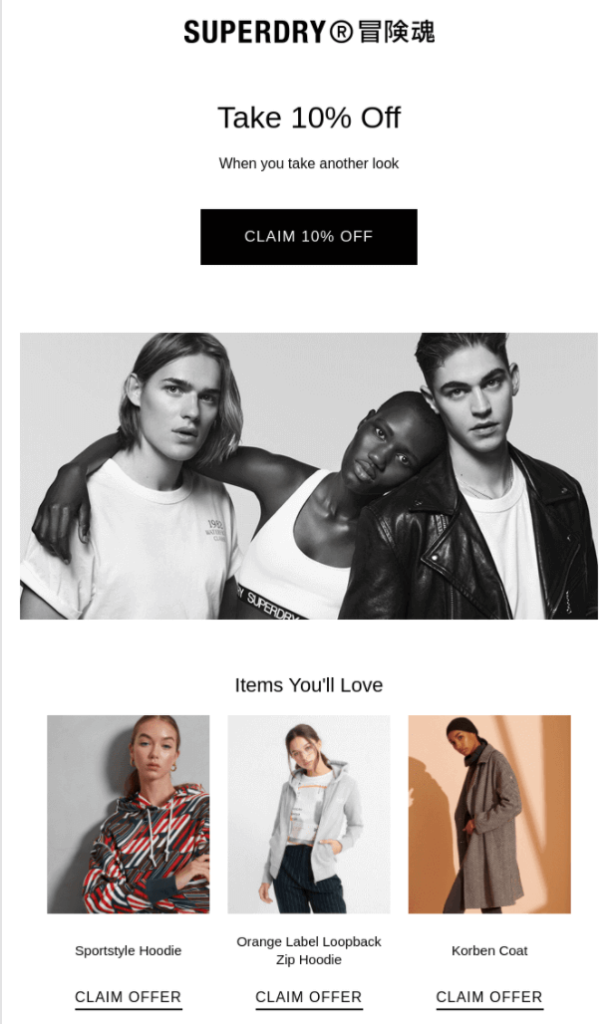
Source: Superdry
The users with the highest level of interest will sign up for a newsletter or other form of email communication. This is vital, as it enables you to see exactly who your most interested prospects are and market to them directly.
UX Best Practices at The Desire Phase
For the Desire stage, your best bet is to arrange a drip campaign, or an automated email campaign, which can be set off by different triggers and sent at strategic periods. For example, when someone signs up or makes a purchase, you can then sent prewritten emails during key periods, such as sales, new blog posts, company news, etc.
Also, although they’re prewritten content, assure that emails are personalized with the prospects’ names or their company names. Emails that appear auto-generated, or lack a human touch, yield a poor UX.
As you may have gathered, content is as weighty a component at this stage as in others. You need to eliminate any traces of a poor UX, such as an image that appears clickable, but doesn’t actually take users to a landing page, enlarging the image instead, a common UX problem. Nothing spoils a customer journey like obstacles in the digital experience — another reason to measure user behavior.
Stage 4: Action
Last, but certainly not least, we’ve reached the final stage: action. This is the most targeted stage of the conversion funnel for obvious reasons. After pumping out UX-optimized content and building a relationship with potential customers, only a small portion of them will make it to this stage.
Most will hang in the balance of desire and action, toggling between the two until they make the decision to either buy or bounce. This is where your UX can make or break you.
UX Best Practices at The Action Phase
First, you need to ensure that the navigation of your product pages are neatly organized so that products are easy to find. Don’t succumb to the UX sin of overstuffing your navigation. Finding your product/service should be a seamless experience.
As for the product pages, each must have selection tools that make it easier for customers to filter out products by way of their particular needs. (Think of common product organization types like size, color, price, etc.)
Additionally, all aspects of this experience must promote purchases, from the ability to zoom in, to quick load times of the actual product pages (when clicked on from a multi-product page), to the product image quality.
Any element can be off-putting at this stage, including non-design bits like pricing, so make sure your UX is superb and built around actual customer intelligence.
UX Insights Throughout the Conversion Funnel Optimization Process
Measuring the success of your marketing efforts does not end while you embark on optimizing the conversion funnel. In fact, you should not approach the conversion funnel as a standalone marketing tactic to reel in more conversions.
This is because not all user experience exists in such a linear way. As such, it may ring true for some users but not all. Particularly, the customer decision journey can be seen as a contrast to the funnel. This can be observed by viewing user paths and segmenting your users to narrow behavior-based categories.
By tackling a specific segment, you can customize the UX to that segment, to assure an optimized journey that reduces exists and bounces. For example, pure player brands understand that their content will not be consumed by a general audience. Only specific segments will visit their sites and social channels. As such, they create content that aligns with the interests of their segmented users.
Impact of Coronavirus on eCommerce: Digital Activity Decreases But Pure Play Brands Set To Emerge Stronger (Update 16)To provide understanding during this uncertain time, we are monitoring the impact of coronavirus on online consumer behaviors. See the latest data on our Covid-19 eCommerce Impact data hub.
As countries and cities open up again, or move to the next phase of their post-Covid plan, consumers everywhere are reconnecting with what it means to go into a non-essential store to make a purchase. We’ve been paying attention to digital shopping behaviors this past week (and since early March), to understand how the Coronavirus crisis has impacted online activity and businesses across industries.
We’ve analyzed more than 10 billion sessions — monitoring traffic, transactions and customer engagement — to see how the unfolding situation has affected digital business. To understand these changes, we’ve compared data from each week with the period immediately preceding the introduction of social distancing and store closures in the West (or, the first 6 weeks of the year, which we call the reference period).
This is what we observed this past week:
Traffic Goes Down For Fifth Consecutive Week But Transactions Remain Strong
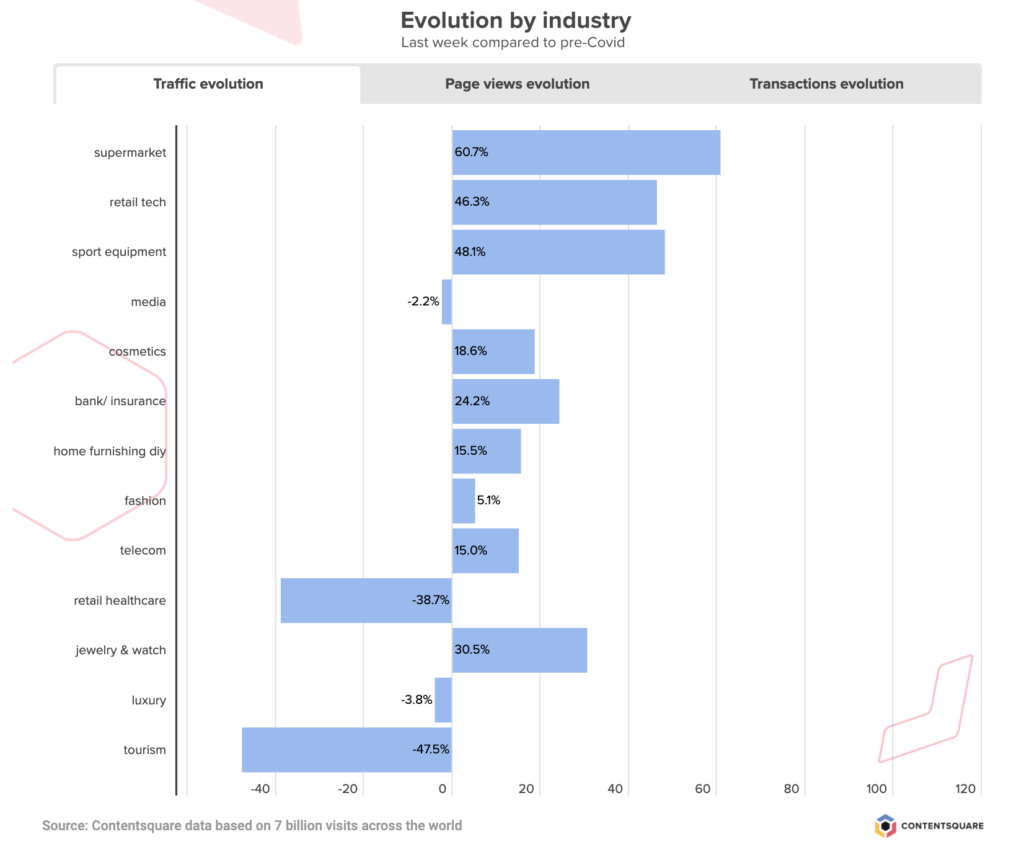
Global digital traffic has been decreasing steadily since mid-May (coinciding with the first wave of store reopenings in Europe), with a new -4% drop in the volume of visits this past week. This puts digital traffic today at +6% pre-Covid levels, although a breakdown by industry shows that some sectors are still seeing up to +45% more visitors than back in February.
Transactions however have not been dropping at quite the rate of digital traffic, with a -3% drop this past week, that does little to make a dent in the +29% transaction increase recorded since the onset of the crisis.
The UK is responsible for the greatest leap in the volume of digital transactions (+63%), while France and Germany have recorded slightly more conservative increases (+14% and +17% respectively). The US numbers are very aligned with the global average, with +28% more digital sales than before the introduction of quarantine measures.
 Traffic to Fashion Sites Stabilizes As Pure Play Businesses Emerge Stronger
Traffic to apparel sites remained steady this past week after several weeks of dwindling digital activity. Transactions were also stable, following a 40 point drop since late May, and the volume of digital sales today is +20% greater than it was before the crisis started.
We also compared traffic and transactions between click-and-mortar and pure play brands, and found that, since reopening, pure players (with no / limited retail) are experiencing more stability with their digital activity. Brands with physical stores are doing slightly better today than their online-only counterparts, but their volume of transactions has been decreasing steadily since late May, while pure play brands appear to be maintaining the increase in sales week on week. As of now it certainly looks like digital-only brands are emerging stronger from the Coronavirus crisis, particularly when you consider that for these storeless brands, extra traffic and transactions are net gains while for retailers the surge of online business was there to compensate for the drop of retail activity.
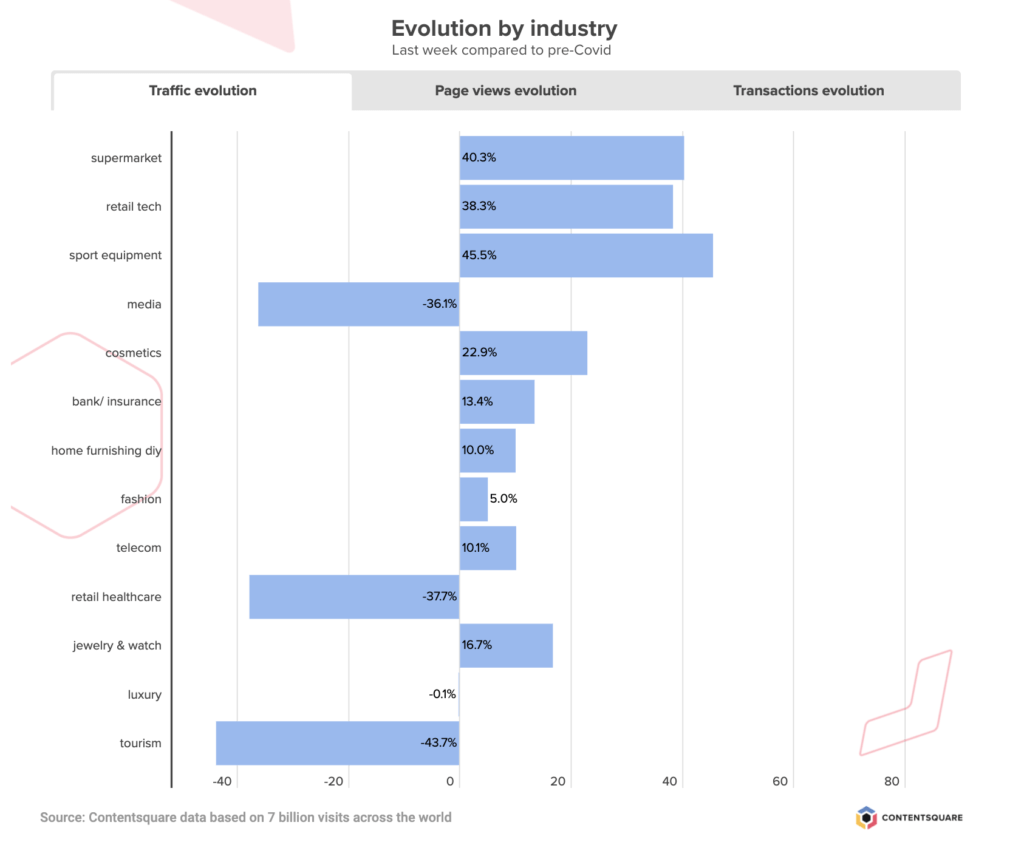
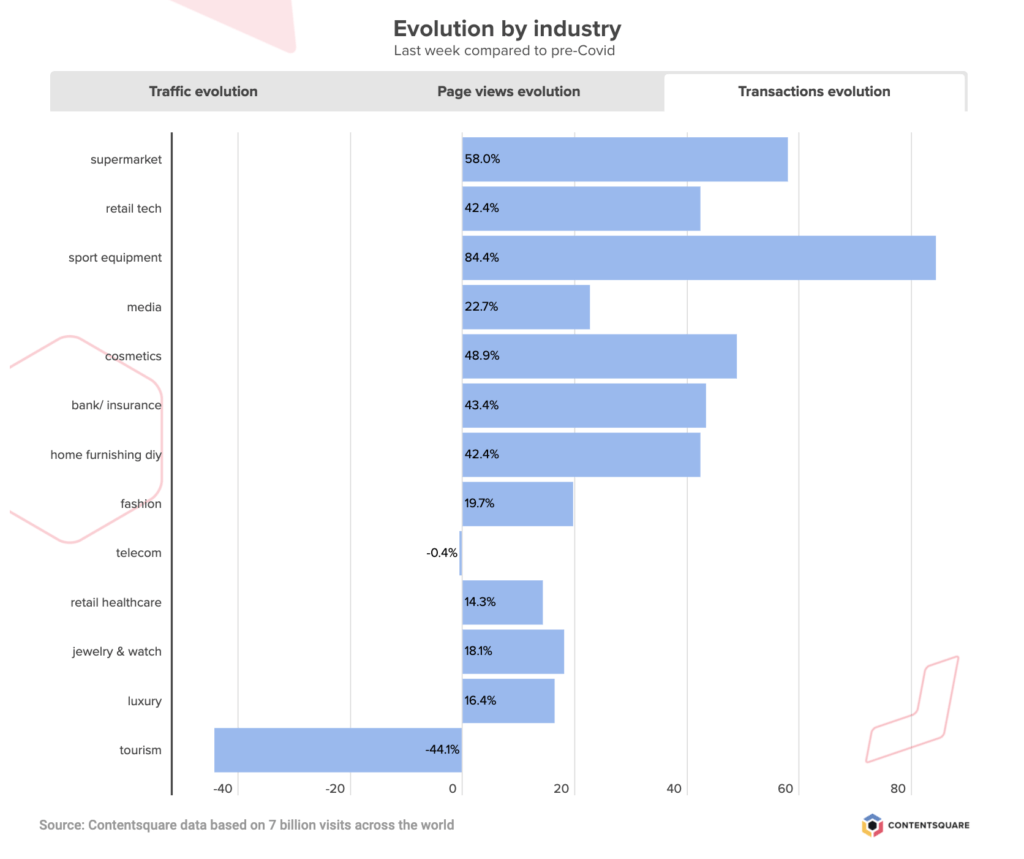
Grocery Sector Loses Traffic But Digital Sales Still Strong
Online grocery traffic continues on its downward trend, having steadily decreased since the massive surge in the third week of March and a more discreet peak in early April. This last week brought a -13% drop in the volume of traffic to grocery sites, but despite this latest decrease, the sector is still enjoying +40% more visits than before the first social distancing orders. And while transactions may have dropped -15% this past week, the global volume of online grocery transactions is still +58% higher than before the start of the crisis.
The breakdown by country reveals different dependencies on digital for food and household staples with France almost back at its pre-Covid levels of digital grocery transactions, the US at around +50% more, and the UK in the lead with more than double the number of sales. As other non-essential businesses open their doors, it will be interesting to see how a ‘return to normal’ shopping habits impacts the collective reliance on online grocery stores.
Tourism Sector Still On The Road To Recovery
Traffic and transactions on travel sites went up +7% this past week, marking another week of growth for the sector that has suffered the most since the start of the crisis. This latest positive chapter makes a small impact on the sector’s digital activity, and globally, travel sites are still experiencing -43% less traffic than it was back in February, and are recording -44% fewer transactions.
France is catching up faster than any other country we analyzed, and is today seeing -20% less traffic than it was before the start of lockdown and -25% the number of transactions. The US is the country that has suffered the biggest drop in visitors although interestingly, transactions are picking up faster in the US than in the UK, despite the UK boasting more traffic.
Have you registered for Summer Camp yet? We’ve put together a six-part series for adventurous experience-builders looking to capitalize on the summer months to fast-track their digital transformation. Join us for our next campfire session with Walmart, to explore common digital challenges and how best to tackle them (A/B Testing merit badge, anyone?).
Impact of Coronavirus on eCommerce: Online Engagement Still High As Many Sectors Record small decline of Traffic and Transactions (Update 15)
To provide understanding during this uncertain time, we are monitoring the impact of coronavirus on online consumer behaviors. See the latest data on our Covid-19 eCommerce Impact data hub.
Our team has been computing billions of user sessions over the past 16 weeks to share insights into how the unfolding Coronavirus crisis is impacting consumer behaviors across industries. Every week we look at traffic, transactions, and engagement data and compare the numbers with averages from the period immediately preceding the beginning of social distancing and quarantine in the West (or, the first 6 weeks of the year, which we call the reference period).
Here are some of the insights we surfaced this week:
Traffic And Transactions Go a bit Down But Online Engagement Remains Strong
After a stable first week of June, eCommerce traffic and transactions dropped slightly this past week, with -4% fewer visits and a -3% decrease in transactions from the previous week. As stores reopen their doors to customers around the globe, digital customer engagement appears to be slowing down. Despite this, online consumer activity is still much, much higher than before the onset of the crisis, prompting many businesses to invest heavily in their digital operations.
The greatest increase in the volume of digital transactions is observed in the UK, where businesses are bringing in on average +67% more online sales than pre-Covid. In the US, this figure is +27%.
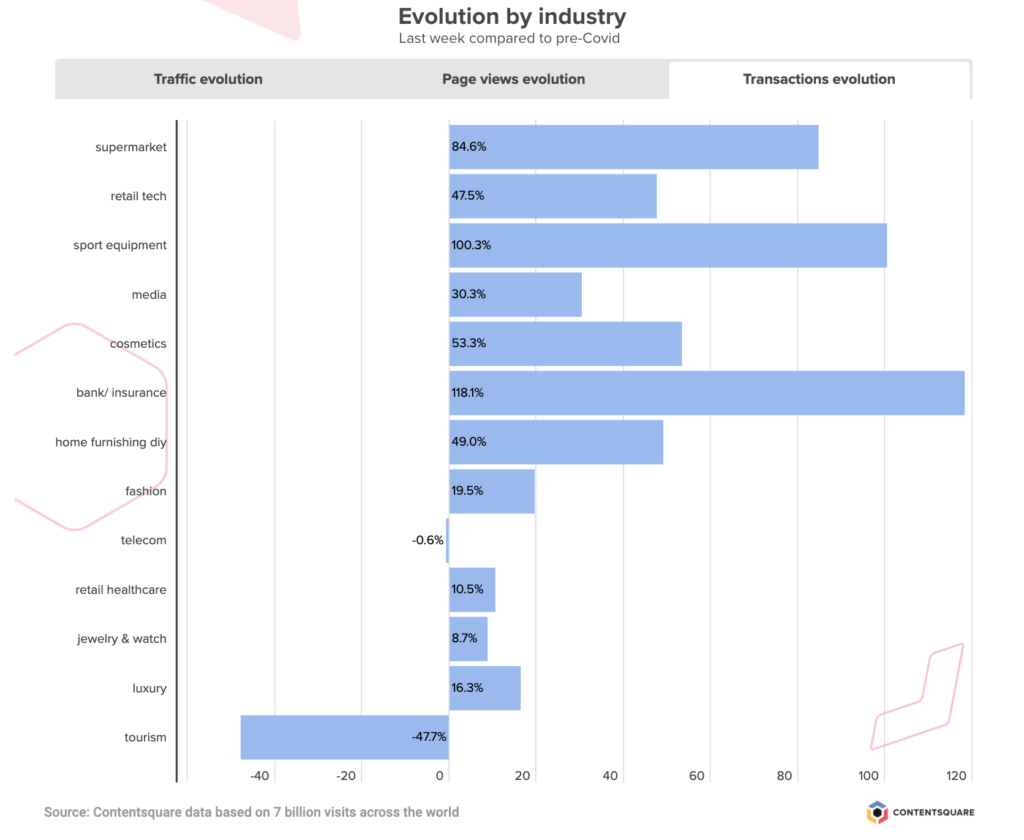
According to our latest data pull for the week ending 6/14, brands across industries are seeing on average +10% more digital traffic than they were back in January, and +33% more online transactions. Some industries — for example, sporting goods retailers or online supermarkets — are even seeing double the amount of transactions they are used to seeing. Other industries, such as travel, are of course dealing with the negative business impact of the pandemic, although recent weeks show positive — if slow — signs of recovery.
Online Grocery Sector Slows Down But Remains Stable in US
After an initial surge which saw regular volumes of traffic increase x3, the grocery industry continues to experience a slow but steady traffic decrease across the board (-10% drop this past week), although the breakdown by country tells different stories of consumer reliance on online grocery shopping.
The UK shows a pretty vertiginous drop since peak traffic at the end of March (from +440% down to +220% pre-Covid traffic levels), while the US has seen stable levels of digital engagement since the first week of April. Overall, traffic to grocery sites is still +61% higher than pre-crisis and the volume of transactions is +85% higher.
Consumer Electronics Sector Sees Slight Drop in Traffic And Sales last week
On the heels of two weeks of quick growth (traffic + transactions), consumer electronics retailers experienced a bit of a slowdown this past week, with traffic declining by -6% this past week and sales going down by -11%. Still, the sector as a whole is recording +46% more traffic than before the start of the pandemic, and +47% more transactions.
In the US, consumer engagement in this sector has been steadily going down since late April, with surges in the UK and France majorly impacting growth.
Tourism Still On The Up And Healthcare Retail Sees Gains Too
After taking the biggest hit of all industries, the travel and tourism sector continues to see its customers’ digital activity climb, with +7% more traffic this past week compared to the last, and +11% more transactions. These recent increases mean the industry as a whole is now closer to half its pre-Covid traffic and transactions levels — although it is important to note that our reference period, in January, would have different averages than during peak season.
While traffic has remained steady in the US since end of April, transactions have been steadily climbing for the past 7 weeks, reflecting greater consumer confidence when it comes to booking travel. Sites selling camping trips continue to see the greatest increases across all sub-sectors — both in traffic and conversions.
Meanwhile, last week was a strong week for Healthcare retailers, with +22% more traffic to these platforms and an impressive +68% increase in transactions.
Have you registered for Summer Camp yet? We’ve put together a six-part series for adventurous experience-builders looking to capitalize on the summer months to fast-track their digital transformation. Join us for six campfire sessions with digital leaders from Tile and other leading brands, to explore common digital challenges and how best to tackle them (A/B Testing merit badge, anyone?).
Impact of Coronavirus on eCommerce: A Week Of Consolidation And Stabilization (Update 7)
To provide understanding during this uncertain time, we are monitoring the impact of coronavirus on online consumer behaviors. See the latest data on our Covid-19 eCommerce Impact data hub.
As businesses continue to be affected by the Coronavirus outbreak, a picture has emerged over the past few weeks of which sectors are recording a steady influx of online visitors, and which are seeing only a fraction of the traffic they enjoyed pre-quarantine.
And while the positive trends observed across “essential” businesses such as grocery stores may be obvious, other verticals have seen a more staggered return to conversions, as consumers resume some of their shopping habits and turn to digital to compensate for a brick-and-mortar economy on pause.
We’re analyzing billions of digital visitor sessions each week to bring you the freshest data from across industries. To do this, we’re capturing user sessions across more than 900+ websites from all over the world — that’s 32 billion pages, 26 countries and 22 industries. To chart the progression of several KPIs (traffic, transactions, pageviews, and more), we’ve been comparing the most recent data to the period immediately preceding the global reporting of the outbreak (or, the first 6 weeks of the year which we call the reference period).
Here’s what we found this week:
Traffic And Transactions Continue To Grow As Online Shopping Habits Resume
Traffic and pageviews are still growing steadily week on week (+6.9% and +8.3% this week, respectively), contributing to a significant increase to both KPIs since the onset of the outbreak. Compared to the pre-Covid-19 reference period, the volume of digital sessions has shot up by +17.4% across industries, with visitors viewing almost +25% more pages today than they were pre-quarantine.
Transactions have also surged dramatically since the first stay-at-home orders in the West, but this past week recorded a slightly more subdued increase than the previous week (+2.1%). Still, overall, the shutting down of brick-and-mortar commerce in many regions of the world has led to a +39.9% surge in the number of transactions.

![]()
Grocery Sector Continues To Grapple With Huge Digital Checkout Lines
Traffic to grocery sites is still surging, with +26% more visits last week than the previous week. Transactions are stable with a slight drop (-2% last week), suggesting many grocery stores are still ironing out some of their supply chain issues.
Despite this minor dip last week, transactions are still up +75.5% from the beginning of the crisis, reflecting the mass adoption of online grocery delivery services over the past few weeks.
Retail Tech And Home Decor Still On Growth Path
Traffic to retail tech sites was up +12% last week from the previous week, contributing to a whopping +78% increase in visits since mid february when the outbreak started in the west. The volume of transactions is also up — +9% this past week and +62% compared to pre-covid19 levels. With a huge swath of the population now working from home, and quarantine measures refocusing entertainment spend, having up-to-date tech gear has shifted from nice-to-have to necessity.
And all this working from home has contributed to the increased traffic to home decor / DIY sites. Last week saw a +9% increase in the volume of visits, driving a +19% surge since the start of the crisis. And home sector transactions have followed suit — up +120% from the start and +17% since the previous week.
Jewelry / Watch, Luxury and Fashion Sectors Bounce Back And Beauty Purchases Slightly Down
While traffic to jewelry sites is much below normal levels, it was slightly up this past week, with a +13% increase from the previous week. And while transactions did grow by +24% over the same period, the industry is still reeling from a -20% drop in sales since the beginning of the crisis.
Similarly, Luxury has continued its recovery, with transactions trending up (+6% last week), and while traffic was flat this past week, engagement was up, with +4% page views last week.
Fashion also continues its recovery: for 4 weeks in a row now the sector has recorded transaction increases, adding another +5% increase to the previous week’s +30% surge, with the sector now exceeding normal levels. As consumers everywhere reintroduce some of their regular shopping patterns into their homebound routine, some industries that were experiencing upward trends were less strong this past week. Recent increases in traffic for the beauty / cosmetics have resulted in a +9% increase in visits since start of the outbreak, while transactions are now up +70% over the same period, despite a -13% drop this past week.
Join our webinar next week, From Convenience to Necessity: How the Coronavirus Is Impacting the Grocery Sector. Featuring our Chief Strategy Officer Jean-Marc Bellaiche, this insight-packed webinar will share our latest findings on customer behavior and how the grocery industry is adapting to the new reality — April 16th, 1pm.
Hero image via Adobe Stock, by triocean
To provide understanding during this uncertain time, we are closely monitoring the impact of coronavirus on digital consumer behaviors. Find all the latest insights on our Covid-19 eCommerce Impact data hub.
Luxury Industry Reels From Coronavirus Impact
While many markets are feeling the negative effects of the ongoing crisis, the luxury sector is hurting more than many adjacent industries such as fashion and beauty.
Overall traffic to luxury sites was down -26% last week (Sunday April 5th) compared to before the beginning of the outbreak (or, reference week), while transactions dropped -18%.
In comparison, traffic to fashion retail sites is up +4%, while the volume of transactions has grown by +23%. The beauty sector tells a similar story, with visits up +14% and transactions more than doubling (+106%).
The volume of pages viewed by visitors to these sites has followed the traffic trend, with a significant decrease since the start of the oubreak. The time spent per session however has remained stable, indicating that for visitors who are browsing luxury sites, engagement has not been particularly affected by the crisis.
Good News In The Last Two Weeks As Traffic & Transactions Grow
It’s not all doom and gloom for the sector though, as the last two weeks have marked a turning point: traffic was up last week, and transactions have been growing steadily now for two weeks. This shows that consumers are now settled in quarantine and most of the spend goes online today, including for non-necessary products such as luxury goods.
Traffic in Asia, in particular, picked up significantly last week, forecasting perhaps a similar uptick in the west as restrictions ease up. Overall, global brand websites seem to be doing better than local eCommerce stores.
Affordable Luxury Most Severely Impacted By Coronavirus
High-end luxury is proving more resilient in the face of changing eCommerce habits than the more affordable end of the market. Affordable luxury brands have seen a -32% drop in the volume of transactions since the beginning of the outbreak.
And while high-end luxury is seeing a greater shortfall in traffic, transactions have actually increased by +8% over the past seven weeks.
With many consumers feeling the negative impact of the current situation on their finances and refocusing their budgets on necessities or needed improvements to improve the circumstances of their quarantine (upgrading their home office or tech equipment, for example), luxuries are some of the first to be cut.
Customers of the very high-end luxury market, however, appear to be feeling less stress on their finances, accounting for the stable — even positive — trend in transactions.
Super high end luxury and mega brands are also less impacted because the intrinsic value of the products is often higher than that of accessible luxury goods. Some mega brands are even able to keep most, if not all, their value in the second-hand market, which can be reassuring in times of crisis.

Traffic of high and affordable luxury in over a month
Transactions of high and affordable luxury in over a month
Hard Luxury Is Slightly Less Hurt Than Soft Luxury Sector
Hard luxury (jewelry, watches) and soft luxury (clothing, leather accessories, etc) are similarly impacted in terms of traffic, with approximately one quarter fewer site visits than before the outbreak.
When it comes to transactions, however, hard luxury is faring slightly better than soft luxury, recording a -10% decrease in purchases versus soft luxury’s -20%. It could be that these often higher price point items are associated with the higher-end brands, which are weathering the storm better than their more affordable competitors.
Another explanation could also be that hard luxury goods are often associated with gifting, and while self-indulgence might be on pause these days, the need for gifting continues (birthday, anniversary…), with purchases now all moving online because of the interruption of brick-and-mortar commerce.

Traffic of hard and soft luxury in over a month
Transactions of soft and hard luxury in over a month
Join our webinar next week, From Convenience to Necessity: How the Coronavirus Is Impacting the Grocery Sector. Featuring our Chief Strategy Officer Jean-Marc Bellaiche, this insight-packed webinar will share our latest findings on customer behavior and how the grocery industry is adapting to the new reality — April 16th, 1pm.
Hero image via Adobe Stock, by artmim
Sheltering In Leads To Home ImprovementTo provide understanding during this uncertain time, we are monitoring the impact of coronavirus on online consumer behaviors. See the latest data on our Covid-19 eCommerce Impact data hub.
After weeks of working from home, working out from home, socializing from home, and doing just about everything from home, data shows that consumers everywhere are in the mood for a little home improvement. With a +22.8% increase in the volume of visits to home decor/DIY stores last week (compared to the previous week), it seems that many have come to the realization that working from your bed is not all it’s cracked up to be.
In fact, consumers have increased the time they spend browsing furniture and home furnishings by +46.8% since the start of the outbreak — the largest surge in browsing time observed across all retail sectors. And looking at the number of transactions, these home makeovers are not just virtual. Transactions on furniture and DIY sites in the UK and US were up +52.3% last week from the previous week, contributing to a +101.4 increase in home purchases since the start of the crisis.
So what exactly are consumers itching to change around the house?
How Towels And Linens Became The New Necessary
The volume of products browsed in the linens / bath linens category shot up +96% last week compared to the previous week, with transactions in this category almost doubling over the same period (+96%). It could be that staring at their bed every day is the push many need to finally get rid of that old duvet cover, or it may be less of an aesthetic decision and more of a practical one.
While 85% of people in America may own a washing machine, legions of renters in major cities like New York don’t, relying instead on laundromats — considered “essential businesses” in many areas of the country. But with millions of people trying as much as possible to avoid trips outside the home, and the CDC recommending you don’t share personal household items when caring for someone who is sick, it makes sense that consumers are looking to increase their supply of sheets and towels.

Home Is Where The Office Is
If you’ve ever subscribed to a furniture store or large retailer email list, your inbox is probably inundated right now with invectives to smarten up your home office. Home office inspiration landing pages and promotions on office furniture have been proliferating the past couple of weeks, and a quick scan of the data shows that consumers are indeed looking to upgrade their work stations.
Visits to pages featuring desks, lighting and tables were up significantly this week from last — in that order (see table above). Those three categories also accounted for the greatest increases in the volume of purchases, with a +95% increase in table sales, +92% in lamp sales and +87% for desks.

Spring Has Sprung
For those lucky enough to have a garden or yard to sit or play in to offset cabin fever, it’s hard to not notice that, even during a global pandemic, plants will bloom in April. Pages featuring garden items and outdoor furniture got +33% more attention this week than last, and the volume of transactions on these items was also up +33%. And with supply chain issues becoming a regular occurrence on grocery stores around the world, victory gardens are making a comeback.
Other product categories that are seeing more traffic and purchases include kids’ room decor — +16% increase in volume of products browsed and +44% more purchases this week compared to last. And purchases of sofas and armchairs have also recorded somewhat of a surge, with a +66% increase in purchases from the previous week.
The growing interest in home furnishings and decor is very much in line with the generalized surge in eCommerce traffic and transactions recorded in the past couple of weeks. Total traffic across sectors was up +3.2% last week from the previous week (+10.3% since the start of the crisis) and transactions were up +18% (+32.6% since the start of the crisis). As consumers navigate a new reality without access to brick-and-mortar shopping, their reliance on digital is now almost entire, and for many brands websites are adjusting to becoming the only store. And with the overall conversion rate up +82.6% since the beginning of the outbreak, the home decor sector seems to be carving out its place as one of the necessary digital businesses.
Join our webinar next week, From Convenience to Necessity: How the Coronavirus Is Impacting the Grocery Sector, featuring our Chief Strategy Officer Jean-Marc Bellaiche, this insight-packed webinar will share our latest findings on customer behavior and how the grocery industry is adapting to the new reality — April 16th at 1 pm.
Impact of the Coronavirus on eCommerce: Grocery Deep Dive
Since our previous report on the impact Covid-19 is having on global eCommerce, we’ve analyzed billions of digital consumer sessions to understand how people are shopping for groceries and household necessities.
As more cities and countries implement social distancing and restrict all non-essential movements, consumers have been turning to online grocery delivery services to stock up on food and household items.
This latest analysis highlights the shifts in product page reach volume over the course of three weeks:
Week 1 — 2/24 to 3/1
Week 2 — 3/2 to 3/8
Week 3 — 3/9 to 3/15
Traffic to non-perishable item pages accelerates as consumers prepare for quarantine
The number of sessions where visitors browsed canned goods increased +17% between weeks 1 and 2, and a staggering +120% between weeks 2 and 3. As consumers continue to stock up on non-perishable items in week 3, the number of visits to pasta and cereal product pages increased by +75%. Meanwhile, egg product pages got +13% more views in week 3.
We recorded a +2% growth in the number of visits to pages featuring bottled water and soft drinks between weeks 1 and 2, and a further +24% increase between weeks 2 and 3.
Traffic spike for household items and health products
The volume of visits to pages featuring household items increased +33% between weeks 1 and 2, and grew by another +70% between weeks 2 and 3.
Over the same period, the number of sessions that included users browsing health and hygiene items increased +29% (week 1 to 2) and +33% (week 2 to 3).
Traffic increases to produce, meat and fish as consumers anticipate limited trips to the supermarket
The traffic to pages featuring meat and fish products was down -14% between weeks 1 and 2 but climbed +63% between weeks 2 and 3. Visits to produce pages were also down -4% in the first period, before increasing +80% the following week.
We will keep monitoring the data over the coming weeks to bring you timely updates on how events are impacting various sectors. In the meantime, our 2020 Digital Experience Benchmark report is available to download and contains key verticalized insights on how today’s consumer likes to browse.

You’ve spent the last few weeks making merry with friends and family, and it’s likely you overindulged. Today, you don’t want to look at another cookie, and you’ve swapped the booze for green juice. You’ve resolved to fill the next decade with yoga and maybe even meditation.
But what are you going to do to improve your digital strategy in 2020? How are you going to go about building a healthier, nourishing, more blissful experience for your customers?
Here is our roundup of 7 trends we think should guide your digital resolutions this year.
1. The experience wars heat up
The numbers have been out for a while: the gulf between businesses’ perception of their own customer satisfaction versus the consumer’s reality is widening. On the other hand, brands that are synonymous with excellent Customer Experience (CX) are reaping outsized benefits. According to a Forrester report, insight-driven companies are growing 7-10x faster than the average enterprise.
The key to a great CX lies with… your customers. The new standards of experience demand greater, smarter customer proximity — one that hinges on a true understanding of what your audience expects and how it wants to connect with you in 2020 and beyond. If you choose not to go all-in on creating an unexpectedly great experience this year, you do so at your own peril.
2. Leaders scramble for new metrics
Knowing how your brand stacks up to customer expectations — and how many different factors from price, to app ease of use, to customer support — contribute to the experience is still a challenge. This is the year many digital professionals will rebel and demand meaningful analytics that are easy-to-consume. Many brands are finding themselves constrained by old metrics, which can tell you how many people visited your site, and how many converted, but don’t offer many clues as to why they left without buying, or if a purchase was in fact the primary goal of their visit.
When it comes to understanding customers, metrics such as content attractiveness and engagement, friction scores and even an objective measure of consumers’ Digital Happiness paints the story between the clicks. You’ll see more CX Index and e-NPS type metrics coming out from agencies, consulting firms and analytics players this year to help meet the demand.
Having access to a system of insights that can capture the nuances and fluctuations of customer behavior, and translate these into actions is how you turn customer intelligence into intelligent CX.
3. More brands flip the acquisition model
Digital teams understand that getting as many people as possible through the door is no longer a viable business strategy. It’s simply too expensive and it is not in fact, a customer-centric approach. Why invite someone in unless you can actually deliver value to them? More brands are shifting their focus to analyzing what happens once customers are on their site in order to better understand who they should be marketing to in the first place, and how.
Think about it — not everyone will want to convert on your site (maybe they’re here to check out in-store availability, use the store locator, etc), and those who do will have a specific customer agenda (they might want to see if a coupon works, to check out fast on their smartphone, etc). The key is to understand: 1) what are your high-value segments, 2) how they like to browse.
By analyzing and understanding the journeys and behavior of customers who are already on your site or app, you can surface intelligence about what they’re trying to do, and in turn, use this intelligence to target specific segments with highly relevant experiences. Don’t forget: the best remedy for churn is a relevant customer experience.
4. Smarter content
Which brings us to content (…don’t all roads lead to content?).
Businesses invest a ton of time and resources into creating content that communicates the brand’s offering and helps customers connect with their values. But how do you measure the impact of content decisions? How do you know what content to display for which audience? How do you maximize your creative investments and merchandising strategy?
Well, it goes back to those smarter metrics. Your customers are giving you real-time feedback on your content with every swipe, tap, scroll, click, etc — each element of your site is either a relevant step in the journey, a distraction, or worse, an obstacle. Customer journey insights are finally becoming operational at scale. And, advanced AI-driven analytics will help translate this customer feedback into actions your team can take to improve the experience and your bottom line. Don’t be left behind.
5. Personalization partners with privacy
Brands in 2020 are going to become better at combining their personalization efforts with their customers’ privacy concerns. Why? Because consumers today want more of both. High profile data breaches and an overload of personalized marketing that isn’t in fact that relevant have made consumers wary of oversharing in the digital world.
But is it really possible to personalize without personal info? We think it is. The beauty of behavioral data is that it delivers on both these demands: privacy and personalization.
Because one consumer does not equate one way to browse a website. And just because a brand knows your name, birthday, address and a few of your interests, doesn’t mean they know what drives you crazy when you’re trying to refill a standing cat food order on your mobile. By analyzing and aggregating the behavior of specific customer segments (based on their context and intent) digital teams can unlock a much deeper, truer type of personalization than that made possible by demographic data.
And if you are going to collect data, the key is to use it well. Be transparent and clear about any request for personal information — customers are often willing to give information that is genuinely going to add value for them.
6. D2C is the new flagship store
Marketplaces don’t afford brands the same level of control over the end-to-end customer experience as direct-to-consumer (D2C) marketing. By entrusting others to promote and sell their products or services, businesses are not only settling for lower margins; they’re essentially giving away crucial customer intelligence they could be using to elevate and personalize the brand experience.
And when you’re competing on experience, as brands are today, owning the relationship with your customers so you can better meet their needs and expectations — and strengthen your community at the same time — is crucial.
This isn’t an entirely new phenomenon, and it’s not only reserved for new, agile startup companies. Leading brands like GoPro have shifted their strategy, and are putting more emphasis on owning the end to end experience, and cultivating a meaningful, enduring relationships with their customers on their digital properties.
7. Inclusivity becomes core to your digital strategy
According to the CDC, one in 4 U.S. adults has a disability that impacts major life activities. So if your website and app are not accessible to everyone, that’s 61 million people (in America only) you’re not including in your CX decisions.
The good news is when you design for disability first, you often come up with solutions that are more advanced and smarter than if you hadn’t. Brands everywhere are putting innovation at the service of inclusivity, and are leveraging new technology to future-proof the CX, improve accessibility, and ensure customer-centricity is not just for some, but for everyone.
Final thoughts
We’re heading into a new decade of innovation, digital creativity and intelligent technology. Your best strategists in 2020 and beyond will be your own customers. The key will be to tune into their expectations and align your experience strategy with their goals.
It’s time to get a new yoga mat, and a new solution to translate customer behavior into profitable CX actions. As you navigate your favorite sites to find the first, think of the dozens of micro-decisions you take as a consumer: click on this image over that one, filter by size, give up halfway through a scroll, login as guest, etc.
We help brands make the journey to digital wellness more seamless and satisfying. The rest is up to you.
Hero Image via Shutterstock, by Boiarkina Marina