Wouldn’t it be nice to gain access to your customer’s every behavior on your website, much like search engines (Google, etc.) extract all the goings-on in your site through their crawling process?
Accessing a deep read of your customer’s digital experience will allow you to know where they’re struggling, as well as where they’re kept engaged and digitally happy.
This is of the essence where user experience (UX) is concerned, enabling brands to create experiences that delight and add value to their customers’ lives. It’s even more crucial when you consider that a visitor who has a bad experience is unlikely to return to a website, much less convert.
Visitors to a site communicate their frustration and satisfaction with every click, hover and tap — tracking these behaviors is the first step towards deciphering the digital conversation to help them achieve their goals.
What is Customer Behavior Analysis?
Customer behavior analysis has a rather self-evident purpose: the methods of analyzing user behaviors of a particular website. It reveals the areas of a site that users engage with, their points of friction and hesitation, and where they show interest or unsurety. It also refers to a slew of other behaviors such as how they click, tap or scroll, empowering you to better understand the impact of your website’s User Experience (UX).
The data and metrics of customer behavior analysis allow brands and marketers to make informed decisions on how to communicate with their audience, along with improving the customer journey on their digital platforms. User behavior analysis pivots you forward in optimizing both the UX of your website, your conversion rates and producing desired customer behaviors (purchases, sign-ups, engagement, etc).
In this way, understanding your customers can spur brand loyalty, in an optimized site, that is. If you understand where users are struggling, you’ll know exactly what to tweak to maintain a healthy brand perception. This keeps visitors engaged with your site and then making their way back to it, the foundation for brand loyalty.
The following is an examination of customer behaviors and their accompanying metrics for a behavioral analysis.
Zooming in on Visiting Manners
We’ll start with the basics; in order to extract insights about visitor behavior, we begin with their visit to your website. Now that they’ve made it to your site, you ought to parse the way they spend their visits and the way they leave, such as through bouncing. This behavior will help you arrive at the elements — whether specific zones or overall design of a page — that need improvement.
Metrics that capture the manners of user visits:
- Visit Time – This metric determines the duration of each session spent on your site. It is a measure of the average time visitors spend from their entry on the site to their exit. It is useful to have, as it can show you how visit duration varies based on unique customer journeys.
- Bounce Rate – The bounce rate shows the stickiness of your website along with the interest users have in the site or offering. The calculation is the ratio between the visitors who entered the site and left it without visiting another page. You should know that if a user scrolls, clicks through images and reads content, but doesn’t make it to a second page, it qualifies as a bounce.

Content Awareness & Views to Establish Your Brand
It is needless to say that if your site visitors don’t see your content, they won’t engage with it, let alone convert. That’s why you need to be kept informed on whether they see certain elements and to know the time they spent viewing them. This behavior is necessary to follow since it shows you how much of your content is known to your users. Before the users engage or hesitate, they come into view with your content, as it enters their consciousness… or not, so you have to measure to be certain.
Metrics that capture points of user awareness:
- Exposure Time – Showing the average time that zone was viewed during a page view, this metric pins down the zones that were viewed the longest. This is important in gauging a visitor’s’ awareness and viewing habits of your content, since it allows you to see which sections they are scrolling past and possibly ignoring.
- Exposure Rate – Identifying how far down a page your visitors are scrolling, this metric tells you how much of your creative content visitors are actually exposed to.
Hesitation: A Behavior Signaling Confusion or Interest in the Content
User hesitation is defined by inactivity while at or around a clickable or interactive element. It reveals your site visitors’ inactivity within areas that would typically require some kind of action. This is also important to record as it shows whether your content is easily understood or leads visitors to pause, or hesitate.
Metrics that capture points of hesitation:
- Hesitation Time – the time elapsed between the last hover and the first click on a zone. This metric helps you understand if your customers are hesitating because they have trouble understanding or accessing your content. However, it may also reveal that they are interested in the content on which they are hesitating.
- Float Time – pointing to the average time spent hovering over an element, this metric also reveals if your users are digesting your content or are confused by it. Since it can represent either interest or confusion, it’s vital to take the type of element being looked at into consideration. Ex: High float times are positive for images viewed, negative when on a CTA.
These metrics should lead you to consider — of the people who hesitate, are they understanding your content? Once you know where your users are hesitating, you can make a move to tackle this hypothetical, from where you can optimize the hesitated elements of your UX.
Engagement: Showing How Well Your Elements Are Understood
Engagement can easily be seen as the opposite of hesitation, as it shows the points in which users are taking action with, or using, site elements. Engagement is a critical behavior to keep track of, as it conveys how intuitive site elements are. When an element is intuitive, it has a high capacity for demonstrating how it should be used by its design alone. For example, a CTA should be easy to see as a clickable element.
Metrics that capture points of engagement:
- Engagement Rate- Relays how intuitive an element is, determined by the number of page views with a click on the zone divided by the number of page views with a hover on the zone. Essentially, it tells you how well your users are engaging with a site element. Getting insight into this behavior allows you to understand if your site elements are doing their job, or at least appear to be. Ex: a clickable element must look clickable, otherwise, no one will engage, i.e., click on it.
- Click Recurrence- Measuring engagement and frustration, this metric shows the average number of times an element was clicked when engaged with during a page view. It’s calculated by the total of clicks on the zone / total number of page views with at least one click on the zone. It allows you to understand if a page element was satisfying or frustrating for your users. It also shows you if users are trying to engage with non- clickable elements. If so, you should change such elements accordingly.
Conversions: A UX Behavior in Itself
The behavior at the very bottom of the sales funnel and every brand’s ultimate goal for their site visitors, conversions need little introduction. These can be segmented as an overall user behavior, one that signifies the highest level of interest with your products.
Metrics that capture points of conversion:
- Conversion rate per click – this metric is able to help you decide if there is an impact on your behavior or conversion goal when a zone gets clicked. As such, it only applies to clickable zones. The calculation is the number of users who click on a zone and accomplished the behavior divided by the number of users who clicked on the zone. You can use this metric to see which zones are helping customers achieve the goal of clicking on a product page. If on a product page, this metric shows which zones help customers add to their carts.
- Conversion rate per hover – similar to the above metric, this one shows you if hovering over a zone impacts the behavior or conversion goal. It’s measured by the number of users who accomplished the behavior and hovered over the zone / number of users who hovered the zone. It helps you decide if hovering over a product’s details result in a high or higher conversion rate.
Customer Behavior Analysis: The First Towards UX Optimization
Site behavior can be measured through a variety of metrics, the more nuanced they are, the more precisely you can understand why your consumers and site visitors behave the way they do. As you can see, each behavior is not only measured by a single metric, in fact there are many more that can be attributed to the broader sense of a behavior. Thus, each behavior is not limited to the metrics laid out in this article. Scoping them out on your website is the first step towards UX optimization, achieving digital happiness for your customers and potential customers and ultimately attaining more conversions.
Why Inclusive Design Should Be at the Heart of Your UX StrategyHow many people with severely impaired vision do you have on your design team? What about hearing impaired? How about color blind? Limited motor function? Or maybe someone with a complex neurobehavioral condition? You might see where this is headed.
According to the CDC, 1 in 4 U.S. Adults, or 61 million Americans, have a disability that impacts major life activities. That is a pretty large chunk of the population that most likely do not have representation on the digital teams creating user experiences.
If you have been reading articles or blogs on UX recently, then you have probably read or scanned at least a couple about inclusive design. There is an excellent reason for this, one that entails more active reading instead of scanning. It’s fortunate that there are now an assortment of articles praising the benefits of inclusive design, because everyone should read at least one.
Designing for everyone doesn’t just help the people you are designing for, it has a beneficial impact on the product as well. So even if inclusivity isn’t your main goal, then sit down, relax, and let’s go over why designing for accessibility and improving your website’s performance are deeply entwined.
AN INTRODUCTION TO INCLUSIVE DESIGN
First things first, let’s define inclusive design. The Inclusive Design Research Centre at OCAD University defines it as such: “design that considers the full range of human diversity with respect to ability, language, culture, gender, age, and other forms of human difference”. So basically it means designing something that is accessible to everyone. Pretty simple.
Now let’s define disability to get a full understanding of the elements involved. The World Health Organization pre-2001 followed a pretty narrow medical interpretation of disability, updating their definition in 2001 to, “a complex phenomenon, reflecting the interaction between features of a person’s body and features of the society in which he or she lives.”
The CEO of Microsoft, Satya Nadella, recently predicted that inclusive design going mainstream will be a dominant trend for 2019 and beyond. He mentioned the growing awareness of accessibility and how important it is to keep designing for disabilities at the forefront of your design strategy. Making it possible for the millions living with disabilities to fully participate in our societies and our economies. “We used to call it assistive technologies and it used to be a checklist of things you did after the product was built,” he said. He pointed out that now it’s “about taking this to way upstream into the design process, where you start up front by thinking about inclusive design.” If the CEO of one of the largest companies in the world is advocating for the importance of inclusive design and how it can benefit everyone, it might be time to listen.
INCLUSIVITY IN THE PHYSICAL SPACES
By now we have all run into books, podcasts, and blogs decrying the inaccessibility of doors to anyone who doesn’t have a hand free. So why is the door knob design still so heavily used? Custom, convention, established practice, force of habit, whatever reason floats your boat. We ARE creatures of habit, and once we design something that works for a large chunk of the population, it sticks. It tends to take a long time to upgrade a mechanism so prevalent in society when a better alternative is finally discovered that works better for the public as a whole. It’s time to start designing with everyone in mind from the beginning. Inclusive design if you will.
Imagine this. You have been seated in front of a pristine white porcelain plate with a single cherry tomato left in the middle. You are given a single fork. Your dominant arm is in a sling after a freak accident involving pizza and a table too far from your couch. How well do you think this is going to go? Even with two working hands, a slippery whole tomato on a plate with dressing can be a battle of wills.

Now imagine that this place is near a VA hospital, so they receive a lot of veteran patrons who have lost limbs. They are able to provide one-handed dining aids. Do you feel that relief? How that potential embarrassing struggle with the tomato is no longer a concern? All because of a design created with inclusivity in mind.
This also happens to be an example of functional limitation. With the human lifespan growing to numbers not previously seen in history, everyone at some point is likely going to experience disability in some way. Whether it’s breaking an arm for a few months, or losing hearing with age.
Disability is essentially context-dependent. It can be a permanent state of being, such as being born deaf. It can also be a temporary position like suffering from an ear infection. Or it can be situational, such as attending a loud concert where hearing anything but the music is nearly impossible. Sometimes designs that were initially prescribed for the specific needs of a specific group end up benefiting many others when least expected.
Let’s take a look a real world example of a design intended to benefit a specific subsect, but ended up assisting everyone. Have you ever traveled down a sidewalk while pushing a baby carriage and ended up stymied by a high curb? What about while pulling a heavy suitcase on wheels? Why isn’t there a curb cut here, you’ve probably asked yourself.
Today, curb cuts are almost everywhere and a convenience that most of us just walk by on a daily basis without noticing. Yet only 50 years ago, these mini ramps were few and far between. Curbs were designed with typical bipedal people in mind. If your mode of transportation involved wheels, like a wheelchair, than your area of convenient mobility has shrunk to one square block.

Only after a movement in Berkeley started by students with disabilities who called themselves the “Rolling Quads” did the issue of high curbs and wheelchair-bound people come to the forefront of neglected disability rights. There is a truly amazing 99% Invisible podcast episode that goes into the history of this movement in detail. It is definitely worth a listen.
What started out as an edge case design transformed into an unintended benefit for everyone. If it isn’t obvious from context, edge case design is the practice of making products accessible to people who fall outside the bell curve of user majority. The people that fall at the edges, if you will.
The advent of closed captioning is an excellent example of technology being leveraged for inclusivity. Julia Child’s television show French Chef was actually the first on TV to be broadcast with captioning. The TV station tasked with bringing Chef Child’s show to the small screen was WGBH, a public broadcasting station out of Boston. Due to the ‘public’ denomination their essential goal was to increase access to the content they were producing.
In strolled the idea of helping the viewers who were hard of hearing or deaf by adding captioning. In 1972 the written words made their debut alongside Julia as she endeavored to teach Americans how to cook. They received A LOT of positive feedback. There were a few hiccups that needed to be ironed out, but in the end it proved to be a success. Now anyone with a hearing disability, or those watching a late-night TV show next to a sleeping partner or enjoying a subtitled foreign film, can enjoy the benefits of captions.
TAKING A TOUR IN ANOTHER PERSON’S SHOES
Can we talk about the New York subway system for a moment? It’s a source of pride for many New Yorkers to be able to tell you which lines to take to get the fastest and most reliable route. This has taken many of them years of haphazard study and constant use to accrue the knowledge necessary.
Now bring a tourist in. Already at a disadvantage due to a lack of knowledge, they often fall victim to irritation from locals, as they loiter in the wrong place trying to read a subway map. Now let’s say that tourist is visually impaired. And in the Times Square Station. There is just no coming back from that.
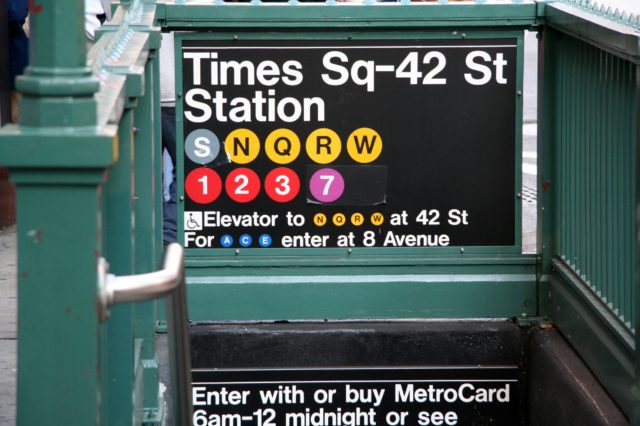
It is not designed following the concept of usability. Trying to navigate the underground catacomb with very little signage, and no clear path to freedom or your destination, makes traversing the enormous station a nightmare for the uninitiated. The subway system was not exactly built with user experience in mind. It is practically impossible to navigate for a person with little to no experience with this kind of public transportation system, let alone for those unable to see the map.
Let’s take it to the other coast by way of the Golden Gate Bridge. San Francisco is not a city known for its efficient public transportation. Instead of a large underground system, it relies on a mixture of a few subway lines, trolleys, and a large fleet of buses. The trolleys may be world-famous, but their reach is limited and relegated to mainly tourist use. The subway is also limited in scope and the buses are notoriously unreliable.
After living there for six years, I can confidently say that there is no comparison when it comes to New York’s MTA in terms of reach and consistency, but that is not the comparison being made here. There is one SF bus driver in particular that is going to be mentioned from one remarkable trip that stands out in my mind.
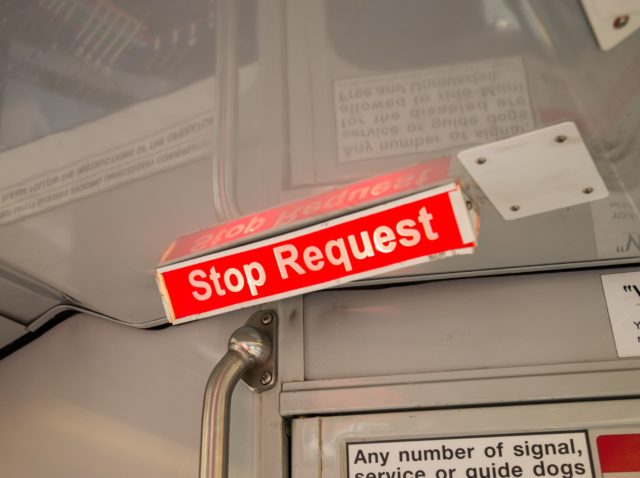
Most of the drivers call out the current stop when they arrive and announce the final destination as they welcome new riders aboard. This aforementioned operator treated his job a little differently. He not only announced every stop, but gave a continuous tour of the route as the bus was in motion.
The peculiarity of the event caught the attention of the normally apathetic commuters. You could see other public transportation riders slowly remove their ear buds to find out what was going on. I almost never take off my headphones when traveling on public transportation, but followed suit when it was clear something unusual was going on. I’m so glad I did.
In between jokes and restaurant recommendations, this man was giving a full on tour to the entire bus full of people, most of whom were just on their daily commute. It turned out that there was a visually impaired traveler at the front of the bus who had requested that the driver let the person know when they had reached their destination. Instead, the driver decided to give the passenger a little overview of the entire section of the city as it passed through the window.
His running commentary provided an in-depth knowledge of the route and the city as a whole: where to get the best coffee, how to reach other parts of the city from particular stops, which direction to walk in if you wanted to hit historical landmarks, delivered with a little bit a humor. The entire bus was smiling by the time they disembarked. It was not a normal bus ride, to say the least.
That ride was undoubtedly remembered by every passenger that day. It provided a service that the majority of those people didn’t even know they needed. I even got a coffee at one of the recommended cafes. It was a pretty decent cup of joe.
Originally a benefit freely given to the person who requested simple assistance, it had became an eye-opening experience for all. I never got the name of the driver and have never experienced a ride quite like that again, but three years later it still sticks out in my mind. That is saying something.
So what do these transportation examples have to do with inclusive design? Good question. Obviously every bus, train, or trolley cannot provide this kind of service on every ride. But it’s not out of the question that the experience could be amended to be better for people with disabilities, and it isn’t out of the question it could benefit everyone.
TAKING IT BACK TO DIGITAL DESIGN
Let’s move out of the physical world and back into digital experience, where accessibility is just as important. Let’s take the example of someone who is colorblind browsing an eCommerce site. They have decided on something to purchase but can’t find the checkout button. It happens to be on the side of page, but the customer can’t see it because it is low contrast and blends into the background. The shopper gets so frustrated that they decide to abandon the purchase and move on. Not ideal right?
Now say a woman is on the identical site on her mobile phone while in a rush. She wants to make the purchase quickly and easily, but can’t find the checkout button while on the move so she puts the shopping on the back burner, never to return.

Making that button more prominent and ensuring a high contrast could have helped both of those potential consumers. As Rory Sutherland, the Vice Chairman of Oglivy, said, “things designed specifically for people with disabilities often end up being valuable to many more people than originally planned.”
When we talk about inclusivity, we are not exclusively referring to the inclusion of people with physical disabilities. There are MANY other differences to keep in mind, such as people who suffer from cognitive disorders like anxiety or depression. If your site has a lengthy sign-up process or a complicated form with unclear labels, people suffering from these disorders are not likely to take the time to stay and work it out. Simplifying the process and providing a clear and easy path makes it more accessible and feasible, not just for people struggling with these disorders, but for anyone in a position where their full attention is not on the task at hand.
IN SUMMARY
Stop thinking of people with disabilities as a niche group that can be relegated to an afterthought. Design for your future selves, the ones who will continually put on and take off glasses in order to get the best view of the menu, the ones who will turn the volume up all the way only to still be unable to differentiate between the background noise and the phone, the ones who will ask their grandchildren to show how to use the new Hologram feature because the small buttons are too hard to press for your shaking fingers.
As disability rights lawyer, Elise Roy, recently said, “when we design for disability first, you often stumble upon solutions that are better than those when we design for the norm.” If we design products with inclusivity in mind, they could last well into the future.
Father’s Day 2018 – Dads Probably Not Getting Ties This YearIt’s been just over a month since we emptied the local flower stores to honor our mothers, and now it’s time to shower our fathers with gifts. Or maybe not exactly shower, judging by the findings of a recent ContentSquare survey.
We quizzed 800 consumers ahead of Father’s Day 2018 to find out how much people were planning to spend on their dads this year, and whether fathers should expect more ties and grilling equipment…
TIGHTENING THE BELT FOR FATHER’S DAY 2018
Almost one in two respondents said their gift would be under $20, with one in four people planning to spend between $21 and $50. Only 4% of the consumers we surveyed expected to spend in excess of $200 on their dads this year.

So did consumers spend all their money on mom a few weeks ago? Of the segment we surveyed, 30% said they had capped their 2018 Mother’s Day budget at $20 – versus 48% for dads – suggesting mothers are the ones who inspire the most generosity.
It is also worth noting that 15% of respondents said they would gladly spend more than $100 on their moms, with only 10% willing to invest the same amount in gifts for dad.
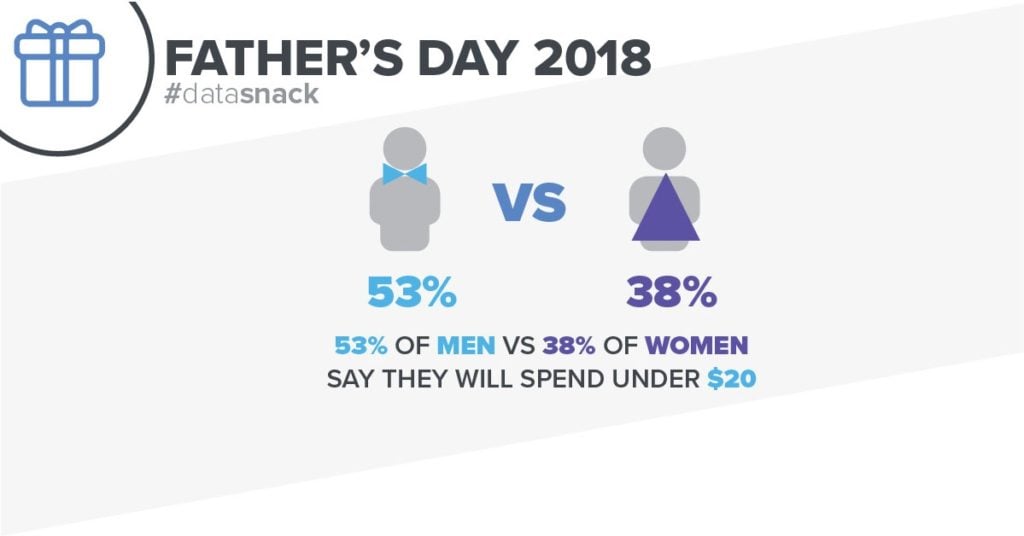
Overall, women tend to spend the most on gifts for their parents, with 53% of men but only 38% of women capping their Father’s Day gifts at $20. Similarly, 20% of men and only 12% of women said they would be sticking to a $100 maximum price tag for their moms.
When it comes to dads, however, there seems to be an even split of men to women for big ticket items, with an equal percentage of men and women planning to spend upward of $100 on their dads.
HOME AND TECH AMONG TOP FATHER’S DAY GIFT CATEGORIES
Still, there could be an ulterior motive to all this spending, since the most popular gifts this year by a slight margin are home improvement products – making up 31% of all gifts. Another 30% of respondents plan to treat their dads to electronics, with speakers, headphones and wearables topping the list of tech gifts. Sporting goods come in third (23%) with clothing and homewares taking up a 15% share of purchases.


This year again, many consumers will be shopping for Father’s Day gifts online, and will expect friction-free digital journeys filled with perks like free or last-minute shipping, easy returns and all the other benefits of a seamless experience.
If you’d like to find out more about the digital gifting habits of consumers in the US, UK and France, read our special digital gifting report. It’s full of surprising (and not so surprising) insights into how shoppers convert from one region to the next, and on what.

Q&A with Bobby Chucas, Product Manager OVO
Energy is a fast-moving industry with changing consumer expectations and intense competition. So – in a crowded landscape of energy suppliers, how can your brand outshine the competition and enhance the customer experience? According to OVO Energy Product Manager Bobby Chucas, the answer could lie in your User Experience (UX).
When it comes to data analytics, how do you think the energy sector compares to other industries like retail?
BOBBY CHUCAS: There’s been a noticeable shift over the past few years to focus on agile ways of working, testing, optimization etc., reflecting a similar change that occurred across other industries such as retail, travel, and gaming.
There have also been a number of newer entrants who have been able to gain traction in the market, based somewhat on the simplicity and quality of their UX. The difficulty here is that there’s a serious amount going on behind the scenes in an energy company, and many of these newer entrants are unable to provide basic operational services, such as installing smart meters, so there’s more to the UX equation than just digital channels. OVO is in something of a sweet spot as we have strong operational capability behind us, while also being customer focused in our development approach.
The energy industry has grown from the big six providers to over sixty in the past decade, and as in any closely contested industry, UX will continue to be a significant differentiator for companies that prioritize it appropriately.
Would you say today’s customers are more engaged with their energy supplier than in previous years?
BC: We see more than ¾ of our customers checking their account online, and that ability to give customers instant access and data is important to keep them engaged with their energy usage, and ultimately their energy supplier.
Energy is more than simply turning the lights off and on. As more people start using more energy, the way they interact with their energy supplier and suite of new services is crucial to engaging with the customer of the future. There are a range of processes and interactions that users undertake with their energy company which makes the overall value proposition more than just their unit rates. And as providers get more effective at conveying this value, they will be rewarded with increasingly loyal, engaged, and satisfied customers.
AS MORE PEOPLE START USING MORE ENERGY, THE WAY THEY INTERACT WITH THEIR ENERGY SUPPLIER AND SUITE OF NEW SERVICES IS CRUCIAL TO ENGAGING WITH THE CUSTOMER OF THE FUTURE.
How have digital channels changed the way customers interact with their supplier?
BC: Many people might not want to always ring up a call centre if they need to manage their account, and the primary focus of our digital channels is to allow users to do everything they need to do quickly and easily. This covers things like submitting meter readings, booking smart meter installations, renewing tariffs – things that were pretty onerous in the past.
In an ideal world, any interaction with your energy supplier should be quick and easy. That isn’t really possible without appropriate digital channels, and by listening to and understanding our users’ needs around available functionality, user interfaces, and support content, we can incrementally iron out any obstacles and hopefully leave our users happier.
What can energy companies do to ensure their online interfaces cater to customer needs?
BC: First things first, you’ve got to know what the customer needs are! For us, that comes from a few different areas: the explicit feedback customers provide over the phone (as well observing the common topics that customers call up about), and the in-app feedback alongside behavioral data that shows how users are engaging with our interfaces.
Secondly, you’ve got to listen to those needs. If you’re able to capture that data and access it appropriately, then you’ll be able to fairly represent the needs and frustrations of your users. Segmentation is hugely important here: the breadth and quality of data you are able to leverage about your users will define how well you can cater to more specific groups, which is often more powerful than one-size-fits-all optimization.
IN AN IDEAL WORLD, ANY INTERACTION WITH YOUR ENERGY SUPPLIER SHOULD BE QUICK AND EASY.
Thirdly, you’ve got to try to meet those needs. By clearly understanding which needle you’re trying to move and what the goal is, you’ll be able to articulate success much more credibly – particularly to stakeholders who don’t necessarily agree with an idea.
Lastly, you’ve got to make sure you’ve met the needs. Obviously A/B testing is the ideal way to do this, but there will be situations where this isn’t really feasible. For example, if we notice that the bounce rate on a certain page is high for mobile devices, and hypothesize that this is down to page speed, that’s pretty difficult to A/B test. But, there should always be a relevant metric that you can observe and understand, while being aware of the impact of seasonality, volume, external campaigns etc.
Once you feel those needs are met, rinse and repeat!

In the UX Spotlight series, we post about UX features that impressed us online, and are great examples and inspiration for anyone looking to enhance their digital user experience.
I recently moved to New York from the other side of the country. Knowing nothing and nobody in this city, everything is exciting and new. With that, I occasionally need two things – love and fresh air. For this, I have the occasional weekend with my sister and her family in Boston, where I can get a reminder of what the world looks like outside of the wonderful mutation I have made my home.
Booking my trip up north is always a happy occasion – I love having a family weekend to look forward to, and with the easy-to-use Amtrak app, all it takes is a few clicks to reserve my tickets. (By the way, I should mention here that Amtrak is not a client of ours…)
On a rainy Monday morning, with a long gray week ahead, I open up the Amtrak app and begin planning my next trip.
WHEN BOOKING A TRIP LEADS TO A GOOD DIGITAL JOURNEY
From the moment I begin, they’ve already made me happy. I get a fleeting vision of the journey I’m about to take – I see a picturesque landscape with train tracks disappearing into the horizon. This is the image that will stay with me throughout my online experience, and for the rest of the week. (1)
I click ‘Book’ in the lower menu bar. The overall look of the app is clean and simple, and the train icon has a charming, old-school feel to it. All this makes me feel more comfortable about booking online. Even the prompt to enter my departure and arrival stations – ‘Where can we take you?’ – is engaging. (2)
Because the system remembers my main stations from previous journeys, this process takes seconds. (3)

The next screen is the best. It just makes me happy. It’s showing me every type of train, whether regional or express, as well as travel class. Not only does it give me only the information I care about, it also just looks good. Notice the color difference between Coach tickets and Business Class Tickets. (4)
Once I pick a train, all the additional details are displayed above the fold. Another menu of pleasing icons – all clickable – lists the amenities on the train I’ve selected. A clickable yellow triangle allows me to consult the service alerts. In a weird way, the honesty of this feature actually outweighs the inconvenience I might feel about a potential disruption. (5)
Next I must enter my details. For many, this is the least favorite part of any digital journey. But instead of making me click to reach payment, the system takes me there in one smooth transition. Right after I’ve picked my train, I am immediately directed to the personal information section, so I don’t have time for that unhappy hesitation. (6)

Each time I reach this page I am reminded that I still haven’t set up a Guest Rewards Number. I do find it slightly annoying that the system hasn’t remembered my personal info. ‘Of course,’ my inner voice says, ‘had you registered and logged into the system, then it would remember you. And now you’re complaining about the system, when you were too lazy to do it – as usual!’
I tell my inner voice that it’s right, of course, but that if I’m too lazy to register, others probably are too. A link next to the Guest Rewards Number box encouraging me to sign up for an account could do the trick.
I like the inline form validation – nothing super advanced or high-tech, but elegantly done. I also like that there are no extraneous questions. Every single thing that needs to be there is there – no optional info.
CLEARLY A LOT OF THOUGHT HAS BEEN PUT INTO WHAT TYPE OF DIGITAL EXPERIENCE A PROSPECTIVE TRAVELER EXPECTS.
Throughout this whole process I can go forward and back to any screen without losing any info. This level of continuity also adds to comfort – it’s always nicer to continue in a process when you feel you aren’t being locked in. ‘That’s why you live in New York – you’re so afraid of commitment it’s even hard for you to commit to a few screens in an app,’ inner voice says. I murder inner voice.
Aside from that opening shot of a sunset, there’s nothing glamorous about this app. It doesn’t use advanced date pickers, video, or animations. It does however make every step of the digital journey simple and painless, and clearly a lot of thought has been put into what type of digital experience a prospective traveler expects.
I also like that, as well as enabling me to complete my booking task, the app connects me to the experience of physically riding a train with the splash screen and cute little icons. I wouldn’t mind even more of that, by the way.
Compared to what’s out there today, this is great UX. Inner voice and I can get this whole booking done in about a minute, and merrily go on with our happy, schizophrenic day.
I think we are not so far from the day that I’ll step into a virtual world and already be there with my sister… I’ll see the New England foliage in front of me and hear the birds sing, even if my body is in a New York high-rise. For now, letting me easily book my trip while giving me small glimpses of a train ride on a gorgeous day is all the experience this user needs.