
The Digital Playbook for Automotive Brands
Download now to discover the biggest digital challenges facing automotive brands and how to overcome them.
Brands today are constantly on the lookout for the perfect user experience (UX) formula that will keep their digital audience engaged all the way to conversion. But connection is a two-way street, and to be successful, requires a sophisticated understanding of who it is you’re trying to connect with.
For that, brands have personas – ideal archetypes of the people who might come to them for goods and services. And while personas are helpful, what they lack are the layers of complexity that define everyday interactions – including browsing for stuff online.
A cosmetics brand, for example, might direct its collection and messaging at a specific demographic. A typical persona might be Coachella Chloe, a 19-year-old college freshman and fashion enthusiast who never turns her phone off. Based on the variables used to define Chloe, our cosmetics brand will make a number of assumptions about the digital behavior of their target audience.
But while some things about Chloe will remain constant, many things won’t. Her behavior online, for one, is subject to any number of influences depending on where she finds herself, what device she’s using, and of course, what she’s trying to achieve.
Making Chloe a happy digital customer requires more than simply taking into account her persona. Only the combining of persona with intent and context can lead to an in-depth understanding of Chloe’s mindset – the emotional foundation that will impact her navigation.
 Become a mindset reader with behavioral analytics
We analyzed millions of user sessions to better understand the digital patterns of behavior associated with different and recurring consumer mindsets.
We investigated three distinct combinations of persona, intent and context, looking at what happened when one of the variables – persona, intent, or context – was different.
To understand the impact of context on mindset, for example, we examined the difference in behavior of a converting group of users on laptop versus non-converting users on mobile. From our research, we were able to extract two distinct mindsets – distracted and determined.
We found that determined users were quick to make up their minds about the products they were drawn to, browsing fewer items and heading straight to the pages that interested them.
They were twice as likely to land on the cart page, for example, than the other group.
Distracted users were 23% more likely to land on a product page than determined users and saw these pages 22.3% more than their determined counterparts. They also displayed an 18.8% higher chance of reaching the homepage during their navigation, indicating longer, more chaotic sessions.
Distracted users on mobile were 17.6% more likely to reach the checkout than determined users on desktop, suggesting a real intention to buy. Despite this, determined users had 59% more chance of reaching the checkout confirmation page than when distracted, presumably encountering enough friction at checkout to defeat their initial purchasing objective.
Determined users also saw the cart page 82% more times during their navigation, spending 1.7 times longer there than when distracted.
Putting consumer mindset at the heart of their strategy helps digital teams adapt interfaces to changing environments and fluctuating user moods. It allows them to move beyond the composite sketch of persona to address real-life situations and the feelings they trigger.
Because digital behavior and digital journeys are anything but static. Coachella Chloe, for example, will browse differently depending on whether she is determined  or distracted. By developing experiences that can adapt to her changing mood, our cosmetics company is that much closer to delivering a consistently satisfying experience to its valued audience.
With more and more brands embracing the idea that customer journeys are fundamentally emotional, I am often asked how analytics can be leveraged into experiences that address the needs of different consumer mindsets.
It’s a great question. With such a huge market for online retail, how do you create seamless digital journeys that meet the needs and expectations of every consumer? And how do you do this knowing that one consumer does not equal one consumer journey, and that visitors will navigate your site differently depending on their circumstances?
Digital marketing teams today have the tools to understand the nuances of visitor behavior, and have started to embrace the emotional side of data. Where they once segmented their audience according to personas, they are now adding a layer of insight to their workflow by adding consumer mindsets to the equation – i.e. the feelings that go hand in hand with digital behavior.
WHERE THEY ONCE SEGMENTED THEIR AUDIENCE ACCORDING TO PERSONAS, THEY ARE NOW ADDING A LAYER OF INSIGHT TO THEIR WORKFLOW BY ADDING CONSUMER MINDSETS TO THE EQUATION.
Think of it this way – digital journeys are influenced by more than just demographics and content. Factors like device, time of day, and quality of service all impact navigation. So do variables like traffic source, customer intent, etc.
For example, when ContentSquare’s office manager is trying to book six flights to Las Vegas on a desktop, she has a different experience than when she is on the subway platform, looking up last-minute package trips to Tulum on a mobile with a spotty connection. She might be focused in the first instance, and frustrated in the second.
The challenge for brands today is to develop navigation paths that adapt to the potential mindsets of their most profitable audiences – answering the needs of focused users and those who, for a variety of reasons, are more distracted in their navigation.
And since e-Commerce disruptors like Amazon or Airbnb have accustomed today’s consumers to a near-faultless user experience (UX), and raised the bar for digital convenience even higher, it can seem like a daunting challenge.
The first step to answering all these different needs is to understand them. Really getting to know the ways in which visitors navigate your site will help you refine segments according to behavioral criteria. It is this level of understanding that will help you tailor optimizations to specific mindsets, removing another layer of guesswork and truly putting consumer experience at the heart of your marketing strategy.
Knowing where that productive mindset drops off, or which field is a field too many for the distracted mindset will help teams focus improvements, and create journeys that can withstand the influence of all those factors brands can’t control.
Because while you may be unable to control your users’ mindset, you can anticipate it, and make sure that your UX caters to it.
To drive a higher conversion rate automotive industry needs to focus on digital experiencesEfrat David, former CMO at Contentsquare, explains why focusing on improving digital experiences is critical to driving a higher conversion rate in the automotive industry.
A business school professor of mine once referenced “buying a car from a dealership” as one of Americans’ top ten fears. And while the nation’s anxieties have evolved since my MBA years, shopping for a vehicle remains a significant pain for many consumers today.1
The automotive industry has long had an unfortunate reputation in the collective unconscious, what with:
And even if you’re not swayed by pop culture stereotypes of car dealers, the amount of confusing information that gets thrown at you when shopping for a vehicle is overwhelming at the best of times.
Like many parents, I spend a significant amount of time driving my kids from one after-school activity to another. But while I may be a veteran carpooler, a Formula 1 driver I am not.
The Digital Playbook for Automotive Brands Download now to discover the biggest digital challenges facing automotive brands and how to overcome them.
Get my free copy
I’m not particularly interested in acceleration stats, high-fangled engine specs or rustproofing. Nor do I want to spend forever negotiating on special features I don’t need or get into lengthy discussions about warranties.
When it comes to picking out a car, my checklist is fairly simple: I’m looking for good mileage, reliable safety ratings and comfort on the road.
My main priorities: An easy buying experience and simple, fast delivery
So when it was finally time for me to get a new car, I decided to go online in order to bypass those long, confusing showroom conversations I’ve grown to dread. I made a short list of my top three car manufacturers and checked out each of their sites. My main priorities: an easy buying experience and simple, fast delivery.
In the end, my online experience was far from seamless, and I had to request assistance from a customer service representative. I did end up buying a vehicle online, but the process was complex enough that it did make me wonder, “Do car manufacturers actually design their sites with the intention of selling online..?”
Or is it high time that the automotive industry embraced conversion rate optimization?
While buying a car online might seem daunting to a lot of people, more and more big purchases and transactions are shifting to the digital sphere. There is a tremendous opportunity for the automotive industry to build up its digital audience by investing in successful online experiences that remove the friction associated with showroom visits. But creating successful journeys online means more than transposing the dealership sales model to digital platforms.
Creating successful journeys online means more than transposing the dealership model to digital platforms.
Disruptors like Airbnb and Amazon have understood that today’s consumers want seamless digital experiences that strike the right balance of giving you the facts upfront and at the same time not overloading you with information.
A brand like Tesla (I did not buy a Tesla) delivers on these points, keeping the process of buying a vehicle as simple and transparent as possible, with a manageable amount of choice for the consumer. Their car configurator is user-friendly, pre-selecting standard models and clearly labelling the value of each added feature for a quick and painless overview of upgrades.
Understanding what consumers are looking for in a digital experience is the first step towards creating journeys that speak to their expectations and are convenient from start to finish. This becomes particularly important when it comes to major transactions like acquiring a vehicle, which is slightly more involved than many of the “one-click purchases” we complete from day to day.
Developing these seamless journeys means knowing which steps and elements cause users to stall or hesitate, or become frustrated. Thanks to AI, analytics today can pinpoint where these obstacles lie so you can focus on fixing the User Experience (UX) elements that still make consumers reluctant to convert online when it comes to cars.
Automotive brands that harness digital experience analytics to understand site visitor behavior and optimize conversion rates will turn their digital platforms into the ideal showroom, keeping up with the digital appetite of today’s consumers and shift more and more of their vehicle sales to the online space.
Just take a look at French car dealership BYmyCAR, who used Contentsquare to optimize its customer journey, increase inbound leads and exceed its goal of doubling its conversion rate.
To find out more about how the automotive industry can drive better conversion rates through digital experiences and overcome the digital challenges facing the industry, read our automotive playbook.
The Digital Playbook for Automotive Brands Download now to discover the biggest digital challenges facing automotive brands and how to overcome them.
Get my free copy
How The Amtrak App Got On Board The Good UX Train
In the UX Spotlight series, we post about UX features that impressed us online, and are great examples and inspiration for anyone looking to enhance their digital user experience.
I recently moved to New York from the other side of the country. Knowing nothing and nobody in this city, everything is exciting and new. With that, I occasionally need two things – love and fresh air. For this, I have the occasional weekend with my sister and her family in Boston, where I can get a reminder of what the world looks like outside of the wonderful mutation I have made my home.
Booking my trip up north is always a happy occasion – I love having a family weekend to look forward to, and with the easy-to-use Amtrak app, all it takes is a few clicks to reserve my tickets. (By the way, I should mention here that Amtrak is not a client of ours…)
On a rainy Monday morning, with a long gray week ahead, I open up the Amtrak app and begin planning my next trip.
From the moment I begin, they’ve already made me happy. I get a fleeting vision of the journey I’m about to take – I see a picturesque landscape with train tracks disappearing into the horizon. This is the image that will stay with me throughout my online experience, and for the rest of the week. (1)
I click ‘Book’ in the lower menu bar. The overall look of the app is clean and simple, and the train icon has a charming, old-school feel to it. All this makes me feel more comfortable about booking online. Even the prompt to enter my departure and arrival stations – ‘Where can we take you?’ – is engaging. (2)
Because the system remembers my main stations from previous journeys, this process takes seconds. (3)

The next screen is the best. It just makes me happy. It’s showing me every type of train, whether regional or express, as well as travel class. Not only does it give me only the information I care about, it also just looks good. Notice the color difference between Coach tickets and Business Class Tickets. (4)
Once I pick a train, all the additional details are displayed above the fold. Another menu of pleasing icons – all clickable – lists the amenities on the train I’ve selected. A clickable yellow triangle allows me to consult the service alerts. In a weird way, the honesty of this feature actually outweighs the inconvenience I might feel about a potential disruption. (5)
Next I must enter my details. For many, this is the least favorite part of any digital journey. But instead of making me click to reach payment, the system takes me there in one smooth transition. Right after I’ve picked my train, I am immediately directed to the personal information section, so I don’t have time for that unhappy hesitation. (6)

Each time I reach this page I am reminded that I still haven’t set up a Guest Rewards Number. I do find it slightly annoying that the system hasn’t remembered my personal info. ‘Of course,’ my inner voice says, ‘had you registered and logged into the system, then it would remember you. And now you’re complaining about the system, when you were too lazy to do it – as usual!’
I tell my inner voice that it’s right, of course, but that if I’m too lazy to register, others probably are too. A link next to the Guest Rewards Number box encouraging me to sign up for an account could do the trick.
I like the inline form validation – nothing super advanced or high-tech, but elegantly done. I also like that there are no extraneous questions. Every single thing that needs to be there is there – no optional info.
CLEARLY A LOT OF THOUGHT HAS BEEN PUT INTO WHAT TYPE OF DIGITAL EXPERIENCE A PROSPECTIVE TRAVELER EXPECTS.
Throughout this whole process I can go forward and back to any screen without losing any info. This level of continuity also adds to comfort – it’s always nicer to continue in a process when you feel you aren’t being locked in. ‘That’s why you live in New York – you’re so afraid of commitment it’s even hard for you to commit to a few screens in an app,’ inner voice says. I murder inner voice.
Aside from that opening shot of a sunset, there’s nothing glamorous about this app. It doesn’t use advanced date pickers, video, or animations. It does however make every step of the digital journey simple and painless, and clearly a lot of thought has been put into what type of digital experience a prospective traveler expects.
I also like that, as well as enabling me to complete my booking task, the app connects me to the experience of physically riding a train with the splash screen and cute little icons. I wouldn’t mind even more of that, by the way.
Compared to what’s out there today, this is great UX. Inner voice and I can get this whole booking done in about a minute, and merrily go on with our happy, schizophrenic day.
I think we are not so far from the day that I’ll step into a virtual world and already be there with my sister… I’ll see the New England foliage in front of me and hear the birds sing, even if my body is in a New York high-rise. For now, letting me easily book my trip while giving me small glimpses of a train ride on a gorgeous day is all the experience this user needs.
Users Blame Cart Abandonment on Price, Choices and Bad UXConvincing shoppers to add to cart is just one of the daily challenges of digital marketing teams everywhere – the real concern is making sure digital journeys end in conversion.
A ContentSquare survey of US consumers aged 18 to 65 found that 81% of shoppers had abandoned their cart at least once in their lifetime.
The 25-34 age group has the biggest tendency for cart abandonment (21%), followed by the 35-44 (20%) and 45 to 54 age groups (13%). The three most frequently abandoned item categories are clothing (40%), tech products (18%) and home ware (16%).
But what exactly causes someone to spend time filling their basket, only to get cold feet at the very last minute?
Not surprisingly, ‘money’ tops the list of reasons, with 74% of surveyed consumers citing price as the biggest obstacle to conversion. Others fill up their cart but simply can’t make their mind up once they get to checkout – with 8.9% of consumers quoting ‘too many options’ as their main reason for not following through on a purchase. For 7.95% of consumer, it’s ‘time’ (or presumably, running out of it) that hinders conversion.
THE THREE MOST FREQUENTLY ABANDONED ITEM CATEGORIES ARE CLOTHING (40%), TECH PRODUCTS (18%) AND HOME WARE (16%).
In fourth place is ‘a poor online experience,’ with 7.30% of shoppers blaming an underwhelming User Experience (UX) for their desertion.
There are many levels of engagement to any digital journey, and the challenge for brands is to meet prospects’ needs every step of the way. Disruptors like Amazon have mastered the art of competitive pricing, but there is still much brands can do to incentivize consumers, including offering free shipping, promotions and exclusive member deals.
Behavioral insights that can identify friction points along the customer journey and tell you why users are frustrated will help your teams roll out the optimizations that will keep visitors engaged until the moment of purchase.

The decline of brick-and-mortar stores in favor of digital shopping platforms is inspiring businesses everywhere to improve their customers’ online experience.
Credit Suisse estimates that there could be more than 8,640 store closures this year, breaking the 2008 record of approximately 6,200 store closures. Meanwhile, the US Census Bureau has recorded a 0.8% increase in consumer spending in November 2017 (a 5.8% hike from the previous year), showing that spending is not the factor.

According to McKinsey & Company, “digital’s share of total retail sales in the United States has been growing by about 15% annually over the past 5-years.” For mobile channels, the growth is +25% in 2017 alone. Today, 60% of Americans have smartphones, and 80% of them shop with their device.
Companies that want to capitalize on this shift need to consider the following 4 trends as they prepare for the future:
Meet Generation Z, the first generation of digital natives. Born into a world of smartphones and streaming, they have very different needs than their forebears.
Customer expectations are changing fast and often. Today’s shoppers are looking to fit shopping around their busy lives – not the other way round.
The rise of Artificial Intelligence (AI) and increasingly sophisticated analytics solutions are revolutionizing the landscape of online business.
The recent Amazon takeover of Whole Foods is just one example of how businesses are embracing the digital revolution, and shifting their focus to online.
DIGITAL USER EXPERIENCE (UX) PLAYS A KEY ROLE IN THE ONGOING CHANGES TO THE CULTURE OF HOW PEOPLE SHOP.
All pointing to the same conclusion: that digital User Experience (UX) plays a key role in the ongoing changes to the culture of how people shop.
In fact, it has widely been reported that UX is the new salesperson. In the past, the consumer would enter a store, and be greeted and advised by a sales assistant. Based on this interaction, the salesperson would assess the customer’s needs and goals, and adapt the experience accordingly. Today’s online customer expects that same level of experience, hence the development of AI and bots to achieve personalized, more human customer journeys.
But personalizing journeys implies knowing your customer inside out. Enter digital experience analytics. These allow you to measure and compare traffic and engagement from one country to another, one device to another, taking into account factors like time of day, mood, reason for visiting your site, and source of origin (Facebook, LinkedIn, Twitter, etc), to name a few. With behavioral data in their arsenal, digital teams are now able to understand why and how prospects use their platforms, and can optimize their sites accordingly.
And with data-driven insights into the real behavior of their digital customers, companies can identify pain points on their platforms, prioritize optimization efforts, and in turn achieve real conversion growth.
Marcus Magarian is a Business Developer in ContentSquare. Reach out to talk about how behavioral data can help your business prepare for the future of digital commerce: marcus@contentsquare.com
4 UX KPIs You Should be Tracking (But Most Likely Aren’t)When marketers want to measure their website performance, they often rely on indicators like conversion rates, bounce rates, session duration, or number of page views.
Just like a doctor conducting a routine check-up on his patient, the use of basic KPIs is an excellent way of monitoring your website’s “health” and a good way to find symptoms of bad user experience. Yet, when it comes to understanding the exact cause of these symptoms, and coming up with the right optimization decisions, traditional analytics are simply not enough.
Here’s 4 KPIs you might not have heard of, but that could become crucial to your online business success.
What is it ? The number of clicks in a row on the same page element. If this indicator gets past 2, it’s a clear sign that your users are getting frustrated. There could be several reasons for this: design misconceptions, bugs, unclear CTAs…
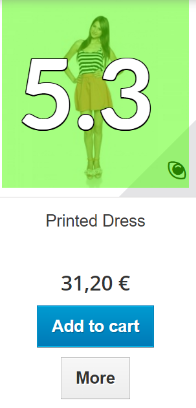 Let’s look at an example. The screenshot opposite is taken from a fashion retailer’s website. We can see that the image is clicked over and over more than 5 times on average… The reason behind it is that the eye-shaped icon, suggesting you can zoom-in or enlarge the image, doesn’t trigger any action at all. That’s typically the type of frustrating experience you want to avoid on a retail website.
Click repetition also often brings to light a very common and underestimated problem for e-commerce websites : the lack of feedback at important stages of the browsing experience. Think of when you put a product in your basket: you’re expecting a confirmation, but what if this confirmation isn’t clear or takes too long to be delivered ? Chances are you click again, and again.
You need to ensure that you prevent this kind of negative experience by tracking this KPI.
On a sidenote, be careful not to misunderstand click repetition for “click addiction” as, for instance, users compulsively clicking on a slideshow could trigger the same KPI.
When a page fails to meet the needs of the visitors, they usually leave, thus generating a high bounce rate. But how do we know whether this bounce is due to inadequate content or to an interaction problem within the page ?
The “time spent” by users on a particular page could give us a hint, but it could be tricky. Indeed, what we really want to know is if people interact with the page.
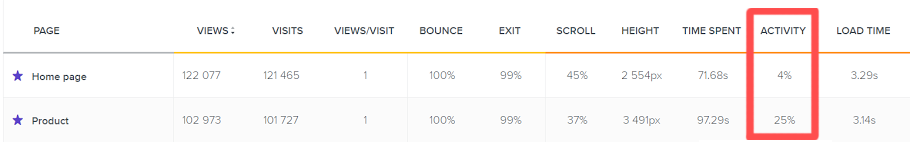
“Activity rate” measures the time spent interacting within the page. In the case of a page with a high bounce rate, a low activity rate would point out a problem in acquisition strategy. To the contrary, a high activity rate would lead us to understand that users leave because the page isn’t responding properly to their interactions.
Thanks to understanding the activity rate, you know what to investigate.
On the following image, we see that “bouncing users” leave the homepage without doing anything (4%), whereas on the product page, they interact before leaving (25%).
We can all agree that creating efficient “call-to-action” buttons is crucial to conversion, but it is also an art. A slight change of words can have huge effect on clicks-through. When you need to figure out which CTAs are more appealing to your users, and which ones are less appealing, engagement rate comes in handy.
In the menu below, we clearly see that “Exclusive offers” is by far the most affording category of the menu, with 12. 6% engagement rate.

A low engagement rate would reveal that the wording is unclear, or maybe that two categories seem to describe the same thing.
By monitoring this KPI, optimizing and reorganizing your menus and CTAs for better performance becomes significantly easier.
Have you ever wanted to know if your checkout page could perform better ? Assessing the time before click would uncover significant insight into being able to address this.
The following two CTAs are checkout validation buttons, taken from two different websites.

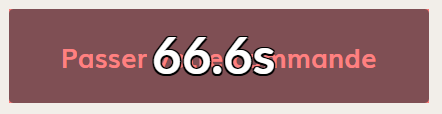
On the first website, users take 43.8 seconds to review their checkout list before clicking on “validate”.
On the second website, it takes them 66.6 seconds to accomplish the same action. That’s 23 seconds longer, and yet the checkout page is way simpler in that case. It’s obvious that something isn’t clear and takes time for users to understand.
Advanced UX Analytics are empowering marketers with a new generation of KPIs that offer to show how users really behave while browsing, leaving intuition aside and allowing data-driven optimization.
Click repetition, activity rate, engagement rate, time before click are some of the new indicators that help leading retailers minimise errors and hesitation times, equipping leading e-commerce brands with the ability to provide a seamless user experience.
What’s your opinion about KPIs ? Tweet us what you think @ContentSquare
To discover how UX Analytics can help you with your business, visit contentsquare.com
Couture Heavyweight Kenzo Sees 150% Increase In Online Conversion RateFor many brands today, keeping up with the fast-moving trajectory of digital retail comes with its fair share of trials and tribulations. Consumers are increasingly aware of what they want, and what they are prepared to put up with to acquire it. And while the ‘nothing ventured, nothing gained’ maxim holds truer than ever, some risks can also lead to losses.
French luxury fashion house Kenzo experienced this firsthand when it recently launched a new checkout page for its online store. The brand, which is the brainchild of Japanese designer Kenzo Takada, came onto the scene in 1970. Over the past five decades, it has asserted itself as a visionary leader in the world of couture, and has earned its place in the canon of fashion history.
Unfortunately, the recent revamp of the site’s checkout page did not translate into improved sales, and in fact, digital teams observed a decrease in the site’s conversion rate. What was it about the new design that was putting customers off? And if the remodel had failed, then what exactly needed to be done to optimize the checkout page?
WITHIN SEVEN DAYS, KENZO SAW A 150% INCREASE TO ITS ONLINE CONVERSION RATE – A FULL 25% UP FROM THE PREVIOUS YEAR.
Understanding customer intent, and tailoring content accordingly is central to providing a satisfactory online user experience. But classic analytics often give only partial insights into user behavior, leaving an awful lot up to guesswork.
Following the drop in online sales, Kenzo was left facing two choices: either return to the original checkout page design, or identify what elements of the new interface were hindering navigation.

The brand decided to adopt the ContentSquare digital experience insights solution to review the purchase funnel, and effectively identify any friction points in the navigation path. The zoning analysis (that shows attribution for every asset on the page) flagged several areas of weakness, including misplaced delivery fields, a convoluted login process, and unclear calls to action — obstacles that were leaving users frustrated, and causing them to drop off.
Thanks to a data-driven assessment of the interface, ecommerce teams were able to focus on fixing proven design flaws with confidence. And this time, the effort paid off. Within seven days, Kenzo saw a 150% increase to its online conversion rate — a full 25% up from the previous year.
To read the full Kenzo case study, click here.