Find & Fix Product Demo
Watch our 6-minute product demo to learn how Contentsquare’s Find & Fix offer can help your business.
Over the past year, as life has globally become more tethered than ever to technology and digital experiences due to the pandemic, site experience and ease of navigation have never been more important. Compound this digital reliance with a saturated marketplace where 100s of retailers compete for finite wallet share and you’ll see why a brand’s ability to present customer-centric moments is essential to success. Even Google has recognized this necessity, tying site experience to SEO rankings as of May 2021. This poses the question of what building a customer journey optimization strategy means for your brand’s website.
In addition to the fundamentals of following UX/UI best practices and creating accessible experiences, the answer lies in merchandising that is optimized to feature content that resonates with the customer. With this challenge in mind, here are 3 tips for developing a customer journey optimization strategy.
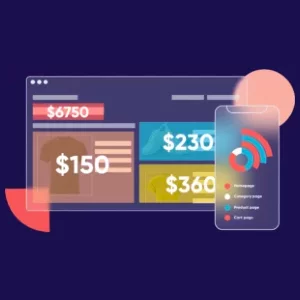
Understand where customers are landing on your website, and how these landing pages impact key site metrics like bounce rate and activity rate. Contentsquare research shows that in 2020, approximately 47% of website visitors abandoned their journeys after viewing just one page on a website. By analyzing how visitors move through your website, it is easy to identify top landing pages by device, acquisition source, or customer type to determine which landing pages have the lowest bounce rate and to minimize friction points for conversion. You can then dive deeper (for example, using our page comparator tool), to understand just how engaged customers are with those various landing pages, and adjust your acquisition and retention strategies accordingly.
It is important to remember that different types of customers experience different journeys and have different on-site triggers to drive purchasing. Just as you would craft an email or retargeting strategy, you can craft your site strategy to foster higher customer lifetime value, higher AOVs, and brand loyalty by identifying and driving key journey paths.
It is also crucial to remember that device type impacts the journey and that desktop and mobile should be evaluated separately. Since traffic continues to be driven primarily on mobile devices, where real-estate is much more limited, prioritizing content that drives engagement is even more imperative. Our 2021 Digital Experience Benchmark Report revealed that mobile traffic increased YOY by 16%, jumping to 65% of the traffic share across industries and accounting for over 70% of traffic in industries like apparel and luxury.
We found that across industries, around 45% of all content goes unseen. To calculate the percentage of content that goes unseen by site visitors, we compare the total number of pages on a site to the number of pages not viewed by 95% or more of traffic.
Identify what content is engaging to the customer and make sure that the most attractive content is at the top of the page, where exposure rate is highest. Using Contentsquare’s zoning analysis tool, you can craft page layouts that are engaging and intuitively drive activity.
Just because content looks good or is an exemplary depiction of your brand, does not mean that it will resonate with your customer digitally. Rely on metrics like attractiveness rate, click rate, hover rate, and conversion rate per click, to build pages that help you to achieve high-level goals and micro-goals on-site.
And lastly…
Every interaction a visitor has on-site can teach you something valuable about your customer’s behavior overall. A granular analysis of customer behavior in relation to specific site elements tells you which pieces of content and element types are resonating with your customer and which are not. Test prioritizing content that drives good customer behavior, like clicking, in your emails, retargeting ads, and social content. On average across industries, it takes an average of 2 sessions to get a customer to convert — using content that knowingly drives engagement post-visit, can help to drive customers back to purchase.
Are you looking to make data-driven decisions about your digital customer experience and take a more strategic approach to customer journey optimization? Learn how Contentsquare can help your business use experience behavior analytics to build better digital experiences.
Our Updated 2020 Predictions: What The Future of Digital Looks LikeIt’s hard to believe that just seven months ago we were coming out of a record-breaking holiday season, experiencing all-time low unemployment rates, and profiting from high consumer confidence. The stars were optimistically aligned for another successful year for eCommerce. The future of digital looked bright until 2020 took an abrupt turn.
As COVID-19 spread across the world, stores and offices shut, workers went remote, consumers’ spending habits and behavior changed, and some businesses struggled to keep up with change. But through it all, digital was the one constant for consumers. But while digital has always been a rapidly changing industry, the pandemic sent many businesses scrambling to beef up their online presence, capitalize on the new onslaught of digital traffic and keep up with changing consumer needs.
In January, before the pandemic, Contentsquare released a series of predictions for what we expected the year would have in store for the digital landscape. Just like how many things didn’t quite go to plan this year, many of our predictions were accelerated by the sudden need to prioritize digital — things we thought would gain more importance over time turned crucial overnight.
Here’s a look at what we got right:
Start of 2020 Context: As brands continue to compete for customer attention and loyalty both in-store and online, they must do more than just provide a great product or service. Companies can no longer think of in-store and online as two separate entities. They need to take an omnichannel approach to build innovative in-person and online experiences that wow customers no matter where and how they interact with a brand.
What Actually Happened: The pandemic and subsequent shuttering of retail stores across the country brought many industries to a standstill. Companies scrambled to update their online presence, but for many brands, the loss of in-store revenue was insurmountable. Brands like Neiman Marcus, GNC, Brooks Brothers, Pier 1 Imports, and many more filed for bankruptcy.
Many brands were able to get creative and capitalize on the rush of digital traffic. Curbside pickup, virtual try-ons, live virtual gatherings with celebrities and fans, and contactless delivery gave customers new ways to interact with their favorite brands and shop from the safety of their own homes. Brands scrambled to think of innovative ways to win customer’s business, accelerating the future of digital transformation as shifting customer behavior made having an exceptional online presence a necessity—not just a nice-to-have. Successful companies were able to maintain that personalized human touch even without in-store interactions and adapt the experience in real-time to fit new and fast-changing consumer needs.
Start of 2020 Context: 2019’s surge of direct-to-consumer (D2C) brands was projected to continue into 2020. Brands found success in cutting out the traditional retail route and selling products and services directly to customers online—think Casper, Quip, and Freshly. Aside from bringing customers more reasonable prices, many D2C brands seem to have cracked the code around building great, personalized, and value-driven experiences to their customers because they own and analyze every touchpoint on the customer journey.
What Actually Happened: D2C brands’ digital-first mindset prepared them for the sudden dependence on online shopping. While most brands were relatively unphased by store closings, many had to overcome supply chain challenges, deal with slower shipping times, and adjust to changing consumer needs. Even in the face of a global pandemic the future of digital D2C brands looks promising. Market research estimates 2020 D2C sales will grow to $17.75 billion, an increase of 24.3% over last year. Even as stores across the world reopen, Contentsquare data reveals customers seem to prefer the convenience and safety of online shopping, a new trend that might be here to stay.
Non-D2C brands can learn from the end-to-end business approach of D2C brands. Owning the customer journey can give businesses more insight into their customers, their behavior, and their needs. Businesses can also have more control over their brand and build both brand awareness and a community that inspires customer loyalty. For example, while technology company GoPro depends on online marketplaces to sell their products, they’ve also adopted a D2C approach. The company made sure to incorporate inspirational video storytelling to create an innovative shopping experience for its audience of experience-seekers and adventurers. This enabled GoPro not only to increase direct-to-consumer sales, but also gave them more control over the end-to-end customer experience.
Start of 2020 Context: Instead of trying to get as many visitors as possible, we predicted brands would put more emphasis on what happens once a customer journeys through their website to better understand who they should be marketing to and how. Brands were beginning to recognize how a strong customer experience can inspire customer loyalty and drive revenue. In fact, a study by Frederick Reichheld of Bain & Company reveals that increasing your retention rates by 5% can increase profit by up to 95%. Instead of pouring money into customer acquisition, more and more businesses will invest in analyzing customer behavior and understanding customer journeys to better serve and target users who’ve already interacted with their brand.
What Actually Happened: Brands slashed their global ad spend by almost $50 billion after the start of the pandemic. That’s more than an 8% decrease in spending, according to the World Advertising Research Center. While traditional media outlets like TV, newspaper, and radio saw the largest impact, online media also took a hit.
Between reduced ad spends, store re-openings, and decreased global traffic, brands have to be strategic to surface opportunities to acquire, convert, and retain more shoppers. Companies need to better understand how visitors interact with their site, identify and improve areas of frustration, and provide relevant, personalized experiences to convert visitors to customers.
Not only do companies need to provide relevant, vibrant experiences, but they need to evolve to meet changing customer wants and needs. This has been most apparent in the last few months as customer preferences have shifted dramatically. Brands have had to be aligned and empathetic to the ways their consumers navigate a health crisis, beyond just shopping for goods.
Even in the face of uncertain economic performance, many brands doubled down on their commitment to corporate social responsibility, by supporting frontline workers, extending help to employees, offering discounts for unemployed individuals, donating to small businesses, etc. Crocs, for example, used its platform to help donate shoes to healthcare workers, donating over 860,000 shoes across the globe. Club Med brought families together by sharing and organizing activities families could participate in from the safety of their homes. The New York Times removed its paywall from all coronavirus content, so everyone could access accurate news on the pandemic. Ford, General Motors, and Tesla converted factories to produce ventilators and medical equipment. The list goes on.
As COVID-19 continues to change the way customers view the world, businesses must focus on the future of digital and continue to show they are mission-driven, compassionate, and socially responsible to win over customers and set their business apart.
While this year has been quite a rollercoaster, 2020 is far from over. While no one knows what else this year has in store for the future of digital and eCommerce, we’re hoping it’s pretty uneventful (fingers crossed).
But, just like how this year has only given us a taste of what it has in store, we’ve only shown you three of our annual digital predictions. For the complete breakdown of the rest of our annual predictions and a look at how COVID-19 has impacted traffic, transactions, and conversion rate across different industries, check out our new “Adapting to The Unpredictable: Using Customer Intelligence for an Always-Relevant CX” Report.
How to Use Customer Journey Analytics to Eliminate Friction for UsersFriction is the number one impediment to a seamless customer journey — a must-have for any brand speaking to today’s hyper-connected and increasingly demanding consumer. Friction can occur anywhere along the customer journey, and even in the most optimized of user experiences, visitors will sometimes run into something that impairs their journey. At worst, these points of friction can lead visitors to completely abandon your website. If the experience leaves a bad taste, this could be the last time you see them on your site.
In order to rid your website, app or mobile site of friction points, you must first identify them, what’s causing them and where they’re most likely to hurt the experience. Only after you’ve determined this information can you undo the obstacles and up your users’ digital happiness. Customer journey analytics serves as the essential tool to understand how your visitors are navigating your site, revealing where friction points exist for your users.
Friction in user experience (UX) is defined as the instance or instances in which a visitor experiences difficulty with your website. The chief concept behind friction is the blockage of users from smoothly and painlessly completing an action. As such, points of friction are one of the main challenges in UX, as they preempt a seamless, intuitive journey. Sometimes they prevent a user from taking an action entirely. Friction can be described in general terms, or general problems within your site, while points of friction point to specific burdensome spots. It’s almost as if you’re doing a spot treat cleanse on your UX.
Friction: A Wide-Reaching Hindrance Customer Journey Analytics Can Tackle
Examples:
Customer journey analytics can be used to detect these hurdles so you can make targeted, data-backed optimizations. Even some of the broader concepts behind friction points — such as hesitation — can be measured with customer journey analytics. For example, you can measure how long it takes a customer to complete an online purchase, or how often customers abandon their shopping cart halfway through. By understanding how customers interact with your website and what obstacles they face, you can make adjustments to your digital experience to reduce friction and increase conversions.
Find & Fix Product Demo Watch our 6-minute product demo to learn how Contentsquare’s Find & Fix offer can help your business.
Take a tour
Customer journeys will vary from user to user, but there are certain universal UX features that can fall prey to malfunction. Some of these are not readily apparent and will require trial and error, with your users running into points of friction when using these elements. It’s good to know where these points typically occur, so that you can zero in on them when perusing through the customer journey analytics. Here are a few places in which friction points can live on your website that you may have not known about.

It’s easy to conjecture that you should look at the user flow, aka the site path, to detect friction. After all, this shows you which pages your customers had visited and where they’re exiting. But as far as friction point is concerned, a birds-eye view, which is essentially what you get when viewing the user flow, is too general.
However, it’s still an important first step. After you’ve viewed a visitor’s user flow, you should move onto a deeper read of how the user was interacting with your site within their journey, which brings us to the engagement rate.
As its name suggests, it shows you how well a page element is being engaged with, or — the percentage of visitors who clicked on an element after hovering it. Among other things, it relays how intuitive an in-page element is, i.e. its capacity to drive interaction.
This metric can detect the friction point associated with a clickable element that appears unclickable. For example, if a CTA, i.e., a clickable element, has a low engagement rate, it isn’t doing its job. Conversely, if a non-clickable element has a high engagement rate, it too is a point of friction, as it shouldn’t generate any clicks, a waste of time for users that ultimately leads them to frustration.
Another metric that will shed light on the experience the hesitation time, which, as its name points out, reveals the friction point of hesitation. It shows if your content is easily understood, as it measures the average elapsed time between the last hover and the first click on an element. A hefty hesitation time shows that visitors hesitate before they click on what they need, a source of great annoyance, especially if they are short on time.
Then, you should look to the click recurrence, which, like the engagement rate, can point to issues with identifying clickable and non-clickable elements. This metric unveils the average number of times an element was clicked when engaged with during a page view and can discern frustration, another common conversion deterrent. A high or low click recurrence can be either good or bad, depending on the context. For example, a carousel with a high click rate shows no point of friction, but good engagement, while a banner with a high click rate is negative in that it demonstrates users expect to land somewhere after clicking on it, but stay on the same page. Also, high click recurrence in form fields is bad news, showing that users are trying to fill in a field that is not allowing them to, thus causing friction.
Find & Fix Product Demo Watch our 6-minute product demo to learn how Contentsquare’s Find & Fix offer can help your business.
Take a tour
As a healthy conversion rate is established when users have a positive UX, a poor one usually paints a picture of friction points. There are several metrics that relate to the conversion rate, or take it into account. For example, conversion rate per hover is a metric that helps you decide if hovering over an area impacts a visitor’s behavior and conversion goal.
It is the number of users who achieved a behavior & hovered over a zone divided by the number of users who hovered the zone. Hovering over an area may not always lead to conversions and this shows you whether the hover was positive or a point of friction.
Take the product details. Does hovering over them lead to a high conversion rate? If not, perhaps there’s friction with understanding the copy, or the imagery of the product is not sufficient for the users to make a purchase or if they’re on a category page, to visit the product page.
Customer journey analytics are a practical way to inspect friction points for your site visitors. Every step in the user journey, from landing, to signing up, to searching, has the ability to either create or remove friction points. This friction can wreak havoc on your marketing efforts, firstly where acquisition is concerned. If you’ve successfully drawn visitors to your website, the last thing you want is for them to have a poor UX, which leads to exits, bounces and possibly, permanent abandonment.
That’s why a seamless, friction-free UX is standard in the current omnichannel environment users visit and brands rely on. The metrics in this post give you a snapshot of how customer journey analytics can be used to find friction points. But there are far more metrics and capabilities (think AI Alerts) that can be used to identify friction points. The more measuring tools you have to pin down these points of friction, the more adept you will be at keeping them at bay.
By understanding user behavior and the points where they experience friction, you can make data-driven decisions on how to improve your customer journey. This will help you optimize the user experience, build customer loyalty, and increase your bottom line.
Find & Fix Product Demo Watch our 6-minute product demo to learn how Contentsquare’s Find & Fix offer can help your business.
Take a tour
How UX Analytics Can Help You Understand Your Consumers’ Decision Journey
UX analytics can help you see how your website is being accessed and used. But did you know you can take this to the next level by extracting behavioral data on your site visitors, such that displays the consumer decision journey? This kind of insight reveals why and how users are interacting with your website.
Customer journey maps help you amass a comprehensive snapshot of all the pages your customers visit on your website during each stay.
Along with customer journey mapping, there is a slew of other UX analytics data that showcases a more granular view of visitors’ site meanderings. This type of data has a twofold capacity: understanding your customers’ mindset as they navigate your site, and digging into what drives (or stalls) the consumer decision journey.
Customer journey analysis aggregates user interactions on your site to help you understand the many paths visitors take through your platform. Mapping out the steps visitors take on your website can help you understand user intent and locate stumbling blocks along the customer decision journey.
You may, for example, notice a spike in one of your site pages. Viewing the traffic on these pages alone won’t reveal much about why or how your users have landed there. That’s where customer journey analysis is useful: it shows all the pages your consumers have gone through before reaching a particular page, or, as most business owners would prefer, before they covert. It’s also useful for revealing where visitors get lost, abandon their journey or bounce.
Accessing this start-to-finish view of journeys allows you to drill down into the navigation patterns of your most valuable behavioral segments for a more granular understanding of what is preventing them from reaching their goal(s).
You may notice some visitors go back and forth multiple times between the category and product page before exiting your site — are they happily window-shopping or are they stuck in a loop, unable to find what they are looking for?
The answer is in the consumer’s decision journey — visitors are communicating their frustrations and delight with the user experience through each of their interactions. Being able to measure engagement (but also revenue metrics) on each in-page element of your site is the next step to removing the roadblocks to conversion.

While customer journey analysis provides an overview, a first look with a high-level vantage point at how visitors peruse your site pages, it’s important to follow it up with an in-depth, in-page analysis. The following section highlights just a few of the metrics that can add a layer of insight to your understanding of your consumer decision journeys and help you derive a deep-read of your customers’ UX on your website. These bits of behavioral analytics will help drive your understanding of your customer’s decision journey into much further detail.
If your content is engaging, there’s a good chance it’s having a positive impact on your consumers’ decision journey. So how do you go about measuring a concept as subjective as engagement? We dot it by combining two other behavior KPIs.
Since clicks are often representative of interest, at least some degree of it, we base the engagement levels off of them. While hovers may also indicate interest among users, they can also point to confusion and even hesitation among site users.
That’s why to measure the engagement rate, we calculate how many visitors clicked on a zone after hovering over it. Specifically, this is reflected as a percentage of visitors who clicked after hovering. Before your customers convert, or if they choose to leave without converting, this KPI divulges which elements are intuitive and which aren’t, which essentially shows you how such elements contribute to your customers’ decision journey.
Piggybacking off of the importance of clicks, click rate delves even further into analyzing how clicks contribute to consumer decision-making. The click rate observes how many clicks occurred in relation to page views, since viewing a page alone does not guarantee engagement.
The click rate is a calculation of the number of page views where a zone was clicked divided by the total number of page views. This metric allows you to determine how many site visitors clicked at least once on a zone (or in-page element) for each page view.
This is relevant to understanding customers’ decision journey since not all page views will lead to clicks and not all zones will receive clicks either.
Understanding how many times visitors clicked at least once on a zone during a page view helps you understand which zones are most engaging to customers. This conveys how these zones and their usage contribute to navigation and bring visitors closer to meeting their goals.
Understanding where users hesitate on your website can convey either interest or confusion and is measured as the time elapsed between the last hover and the first click on a zone. While some site elements allow you to infer your visitors’ sentiments when they hesitate, others might require some more digging.
Perhaps the copy isn’t clear, maybe an element’s clickability is murky. In either case, you should survey hesitation time in order to understand if your content is easily understood.
This metric is ideal for interpreting whether images are being consumed properly. For example, if a text-heavy visual has a high hesitation rate, it could simply be a sign that the content is being consumed as intended. On the other hand, a visual with little copy and a high hesitation rate could convey confusion and present an argument for optimizing the UX of this area.
Clicks are demonstrative of some level of interest, but wouldn’t it be great to know if clicking on a zone impacts your behavior and conversion goals? Well, there’s a certain UX metric that can measure just that: conversion rate per click. This metric is determined by the number of users who clicked on a zone and completed the behavior, divided by the number of users who clicked on the zone.
This is especially useful when analyzing a category page, in that it shows which zones are helping customers achieve the goal of reaching a product page. After all, they need to be on a product page to view your products and most importantly, buy them. When users are on a product page, this metric helps you analyze which zones are helping customers accomplish the goal of adding to their cart.
In these respects, this metric gauges the performance of zones according to your business objectives. It helps you see the strengths and weakness of your content and pinpoints the role of the zones on a page in propelling your visitors’ decisions.
When analyzing visitor journeys on your site, it can be tricky to understand why your site users behave the way they do. Digital behavior insights can help you visualize the frustrations and impediments along the decision journey, helping you see which elements of your platforms are intuitive or obtuse, clickable or not, conducive conversions or off-putting.
Key to improving the experience for customers is first and foremost understanding what it is they are trying to achieve on your site. With a bird’s eye view of their navigation and an elemental analysis of each touchpoint, you can optimize the decision process and maximize conversions.
France’s Answer To Black Friday Drives Increase In Mobile TrafficIn spring 2018, six French eCommerce brands launched their own riposte to Black Friday — the one-day retail extravaganza that kicks off the US holiday shopping season. More than 200 brands took part in the first ever Les French Days, a five-day event designed to boost sales during the post-winter/pre-summer sales lull. Building on the success of the first event, retailers decided to repeat the operation this fall, slashing prices on thousands of items between September 28 and October 1.
ContentSquare analyzed 68 million user sessions before and during this latest round of Les French Days, to understand the impact of the event on digital consumer behavior. We also compared these findings to our analysis of 29 million user sessions captured just before and during Black Friday 2017 — a record-breaking day for US eCommerce.
The majority of retail traffic during this latest iteration of Les French Days came from mobile, with the device accounting for 48% of all digital traffic from 09/28 to 10/01 — a 6% increase from the period immediately preceding the sales. This pushed desktop into second place, with traffic from the device dropping from 48% to 45%. Tablet traffic remained constant at 6% throughout the event.
While the increase to mobile traffic during Black Friday 2017 was noticeably smaller (only 2.44%), the trend does support the argument that sales campaigns encourage more on-the-go shopping. By streamlining their mobile UX, brands can capitalize on the sense of urgency generated by major seasonal sales campaigns.
Perhaps unsurprisingly, Black Friday and its new French sister event are a tonic for conversion rates. In 2017, Black Friday triggered an impressive 28.57% increase in mobile conversion rates and a 44.44% CVR increase on desktop. Not to be completely outdone, Les French Days led to a 19.15% conversion rate increase on desktop and more timid 6.5% boost to mobile CVR.
Seasonal sales events attract a more committed consumer, with reduced bounce rates observed across all devices. The biggest drop is attributed to Les French Days, which result in 9.56% fewer bounces on desktop.
Les French Days also get the medal for the highest increase in page views, with desktop users viewing on average 16.54% more pages than before the event. Mobile visitors view 12.56% more pages during the same period, proving that consumers on all devices are keen to engage with the new sales content. Black Friday saw its biggest page view increase on mobile, with users viewing 9.37% more pages during the weekend event. In fact, the only decrease observed when it comes to content consumption is a 4.09% drop in the average session time of mobile shoppers browsing les French deals.
Data shows that seasonal sales increase thrifty consumers’ willingness to engage with promotional content while on the go. During the sales periods, retailers have their customers’ attention — analyzing navigation patterns to pinpoint where users hesitate, or abandon their navigation is key to developing successful buyer journeys. Intuitive paths that get customers from point A to B in fewer screens, shorter forms and streamlined checkouts — there is much retailers can do to keep mobile users engaged all the way to conversion.
Look out for our Black Friday coverage!

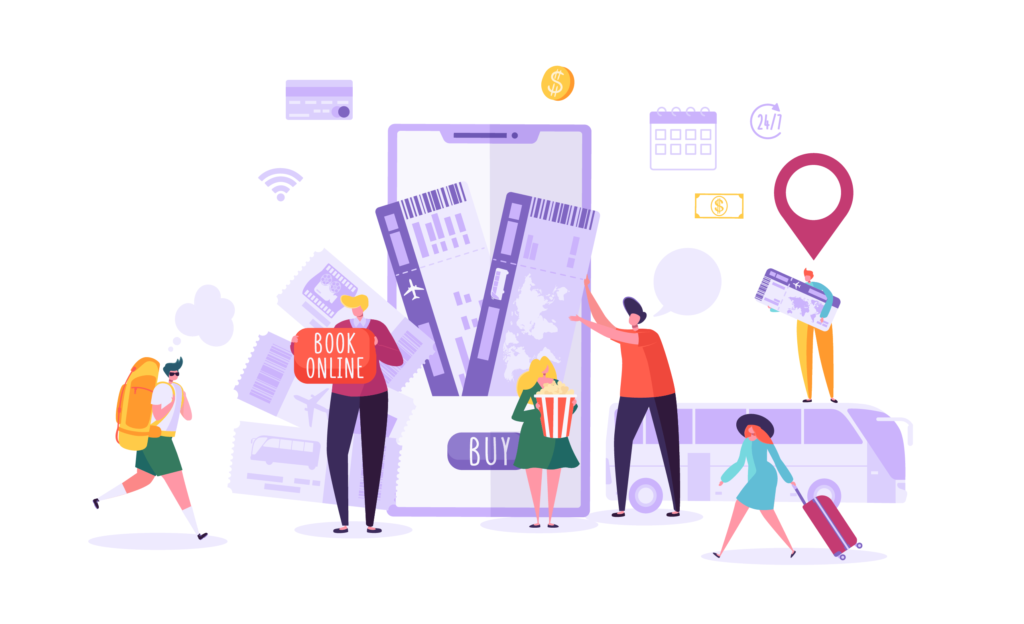
Convincing shoppers to add to cart is just one of the daily challenges of digital marketing teams everywhere – the real concern is making sure digital journeys end in conversion.
A ContentSquare survey of US consumers aged 18 to 65 found that 81% of shoppers had abandoned their cart at least once in their lifetime.
The 25-34 age group has the biggest tendency for cart abandonment (21%), followed by the 35-44 (20%) and 45 to 54 age groups (13%). The three most frequently abandoned item categories are clothing (40%), tech products (18%) and home ware (16%).
But what exactly causes someone to spend time filling their basket, only to get cold feet at the very last minute?
Not surprisingly, ‘money’ tops the list of reasons, with 74% of surveyed consumers citing price as the biggest obstacle to conversion. Others fill up their cart but simply can’t make their mind up once they get to checkout – with 8.9% of consumers quoting ‘too many options’ as their main reason for not following through on a purchase. For 7.95% of consumer, it’s ‘time’ (or presumably, running out of it) that hinders conversion.
THE THREE MOST FREQUENTLY ABANDONED ITEM CATEGORIES ARE CLOTHING (40%), TECH PRODUCTS (18%) AND HOME WARE (16%).
In fourth place is ‘a poor online experience,’ with 7.30% of shoppers blaming an underwhelming User Experience (UX) for their desertion.
There are many levels of engagement to any digital journey, and the challenge for brands is to meet prospects’ needs every step of the way. Disruptors like Amazon have mastered the art of competitive pricing, but there is still much brands can do to incentivize consumers, including offering free shipping, promotions and exclusive member deals.
Behavioral insights that can identify friction points along the customer journey and tell you why users are frustrated will help your teams roll out the optimizations that will keep visitors engaged until the moment of purchase.

In the UX Spotlight series, I post weekly on UX features that impressed me online, and are great examples and inspiration for anyone looking to enhance their digital user experience.
Successful online retail depends on the confidence of your shoppers. Customers need to feel sure that they’re making the right purchase, even though they can’t physically feel or inspect the merchandise. When it comes to clothing, this can be a major obstacle for some shoppers, who hesitate to purchase without the opportunity to try on items.
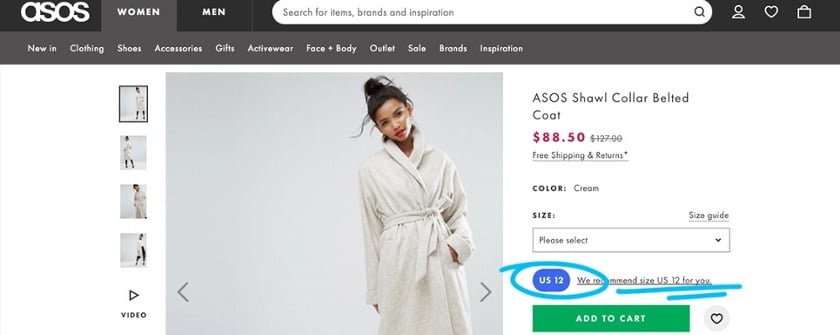
This week, we spotlight online clothing retailer ASOS and the clever way they put customers at ease, both boosting sales and lowering returns.
The product pages on ASOS have a rather typical layout overall, with a variety of photos, a video, and basic shipping information. However, what makes ASOS unique is that above the green “add to cart” button is a link inviting new shoppers to “find out what size people like you bought.”
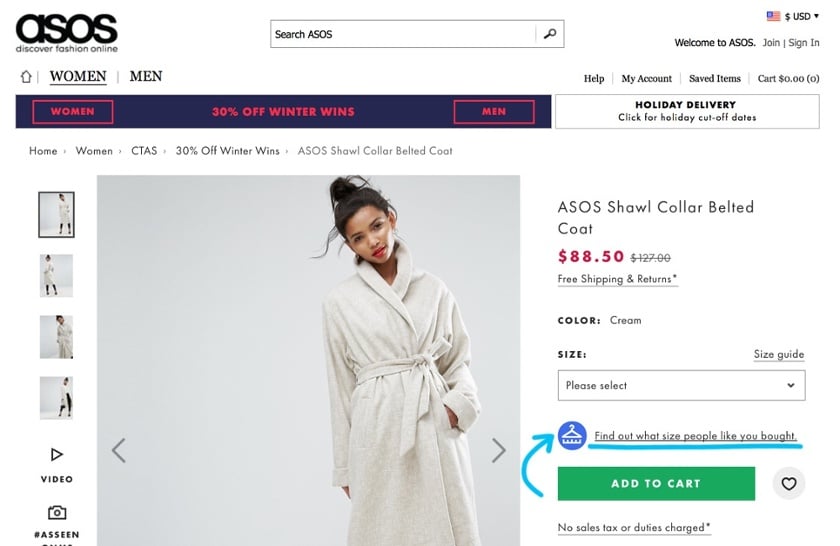
When clicked, a simple popup appears inviting customers to fill out their particular measurements, including height, weight, and preferences regarding if they like clothing to fit more tightly or more loosely.
Next, to get an even more accurate fit, shoppers can enter their dress sizes in other common brands, or they can skip that step.
ASOS then offers a reading based on the data entered: what the most commonly ordered size was for shoppers with similar measurements of this particular dress which resulted in the fewest returns.
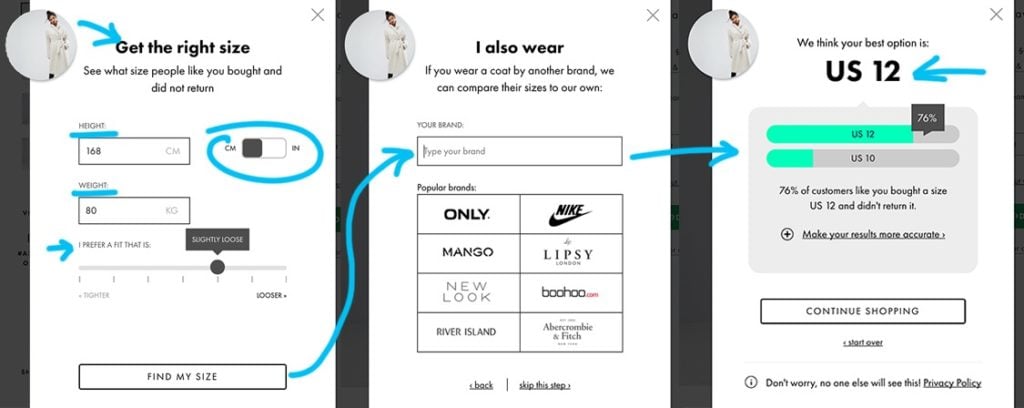
If a shopper is satisfied with that information, they can continue shopping. However, if they want to be extra sure they are choosing the right size, there is yet further opportunity to specialize the sizing estimate by selecting the “make your results more accurate” option, which then prompts a series of other, more specialized popups:

After shoppers add as much detail as they wish, they can view a revised summary of their size estimation.
From then on, customers who are logged in or in the same shopping session will view a size recommendation on each product page based on their responses:
Because of ASOS’s clever customer journey design, customers can have unparalleled confidence in their purchase. This sizing estimation has some benefits:
Social proof: It’s not just that ASOS suggests a size based on measurements – they suggest a size based on previous customers’ experience and satisfaction. This subtly builds customer trust in the brand by showing them how many other shoppers with their precise needs were happy with their item of interest.
Brand confidence: By asking shoppers their sizes in other common brands, ASOS projects confidence in the face of competition, and even uses that competition to their advantage by deducing from which competitors a shopper enjoys the best products to recommend them.
Customer loyalty: Once customers have their size saved in the ASOS system, it increases their likelihood of returning to the site to shop because every product page takes their personal needs into account, whereas competitors now lack this customized information and edge. Furthermore, it will motivate returning customers to log in so they can use their previously entered stats, and on average, logged in customers have a 25% conversion rate!
Reduce returns: Customers receiving a correct sizing information means they will be more likely to be satisfied with their purchase, and less likely to return items.
Valuable data gathering: Of course, don’t forget that every bit of data from your customers helps you further tailor your digital experience to better meet shoppers’ needs and, in doing so, ramp up conversions and repeat business.
A SUPERIOR CUSTOMER JOURNEY CAN TAKE THE PLACE OF THE FRIENDLY FITTING ROOM ATTENDANT, AND INSPIRE THE SAME CONFIDENCE AND JOY IN THE SHOPPING EXPERIENCE.
Gone are the days of puzzling sizing charts and guesswork in mail-order catalogs. Through UX features like this one, online retailers have the opportunity to provide unprecedented assistance and guidance to customers. A superior customer journey can take the place of the friendly fitting room attendant, and inspire the same confidence and joy in the shopping experience.
It’s that confidence that leads customers to conversion and keeps them coming back for more.
I am always on the lookout for UX innovation. If you come across a digital experience that stands out, please send it over to pola.zen@contentsquare.com
UX Spotlight: Superior Checkout Experience – Conversion or bustIn the UX Spotlight series, I post weekly on UX features that impressed me online, and are great examples and inspiration for anyone looking to enhance their digital user experience.
Checkout is the moment of truth for eCommerce sites. Your customer journey has brought shoppers this far – can it bring them all the way to conversion?
MORE THAN HALF OF SHOPPERS ARE INTERESTED ENOUGH TO PUT AN ITEM ON THEIR CART, BUT THEN SOMETHING STOPS THEM FROM TAKING THAT ITEM HOME.
Statistics vary, but overall it seems the shopping cart abandonment rate is about 60%. More than half of shoppers are interested enough to put an item in their cart, but then something stops them from taking that item home. One of the most direct ways online stores can boost their bottom line is by improving their checkout process and getting interested customers to convert.
This week I look at several different companies improving their checkout process in three key ways: Fun, efficiency, and added value.

You know when waiters say “good choice” when you choose your lunch, and it affirms you and heightens your anticipation for your meal at the same time? Buying online should offer shoppers similar feedback when they pick out an item.
Threadless, a trendy t-shirt company that sells customer-designed, customer chosen apparel, is a great example of this tactic applied to eCommerce. When you add a shirt to your cart on Threadless, your cart thanks you in a quirky way.
The cart even winks or licks its lips!

It’s unique touches like these that make shopping memorable. And with a quirky product line like Threadless’s, it only makes sense. Every step in a digital experience should fit the tone of the brand, so even an add-to-cart popup should be part of the immersive customer journey. Besides, this kind of immediate feedback encourages customers to continue, because their actions produce an instant reaction, and they’ll want to see what happens next.
In a survey of why customers abandoned their carts, 23% of them said it was because they were forced to create a customer account, and they preferred to jump ship than to go through account creation.1
A guest checkout option is imperative in today’s eCommerce environment, especially because 60% of shoppers are now browsing on mobile, and creating an account is beyond cumbersome with your thumbs on a touch screen. By forcing customers to register, you are pushing them away.
Many sites offer two options when entering checkout: to proceed as a guest, or to login to an existing account.
Threadless nails it again, with the rising trend of defaulting to guest checkout while giving the option to login:

Threadless’s entire checkout process is condensed onto just one screen, making the light at the end of the tunnel seem much closer and more attainable. If the checkout process is a sprint, then each step is a hurdle. Removing the login/guest choice and going straight to data entry is removing a hurdle and bringing your sprinting shopper one step closer to conversion.
Another brand pioneering simplicity and efficiency in customer journeys is eyewear retailer Warby Parker. When it comes to filling out that data, Warby Parker’s approach is notable due to its highly responsive auto-fill option, which can guess a complete address after just a few characters.

But check-outs can offer more than simply speed and convenience. In fact, British appliance retailer AO.com offers additional value during their checkout, helping shoppers achieve a more streamlined customer journey while potentially increasing their cart value.
For starters, when viewing the cart, AO offers checkboxes for additional features that could help that customer. When I tried to check out with a smart TV, for example, AO asked if I also wanted help with installation or old appliance removal, and made it easy for me to accept that assistance:
Offering extra services makes shoppers feel like everything is taken care of, and there’s nothing else to worry about.
OFFERING EXTRA SERVICES MAKES SHOPPERS FEEL LIKE EVERYTHINGIS TAKEN CARE OF, AND THERE’S NOTHING ELSE TO WORRY ABOUT.
This not only upsells, it also eases any concerns a customer might have about all the nitty-gritty details that might go with a major purchase like home electronics. Offering extra services makes shoppers feel like everything is taken care of, and there’s nothing else to worry about. Furthermore, AO uses friendly, accessible language throughout their checkout process. Instead of technical legalese, they speak to the shopper like a salesperson would in the store, which is exactly the role of a good digital experience.
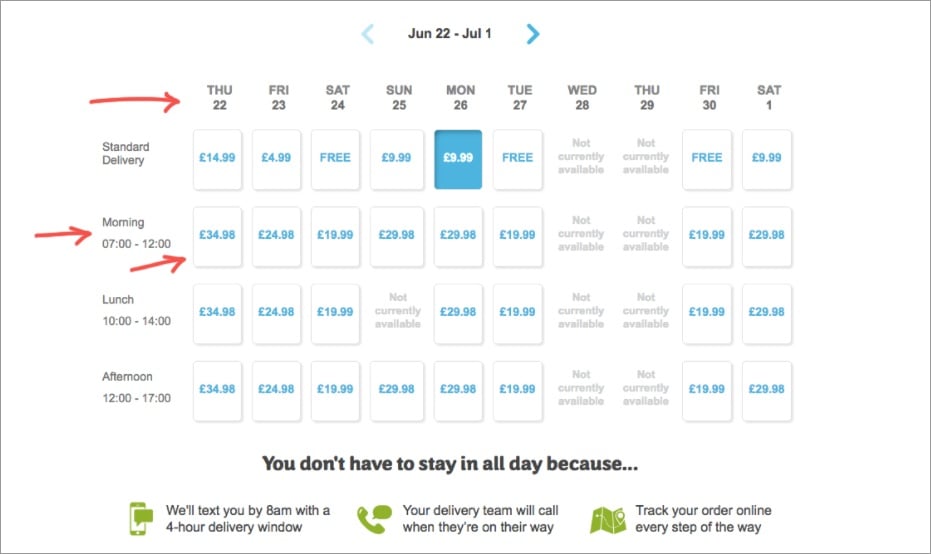
AO also goes above and beyond when it comes to shipping, which is key, because unexpected shipping costs are another notorious checkout obstacle. They allow customers to choose a delivery date and time, transparently showing the prices for each.
AO also enables online order tracking to calm impatient purchasers while their item is on the way.
The proof is in the purchases. Case study after case study illustrates how streamlining the checkout process increases conversion.
For example, in an A/B test, Electronic Path Software found that its conversions increased by 21% when it shifted from a multi-step to single page checkout process.2
Similarly, a Strangeloop test found that conversions declined by 60% when a page loaded 2 seconds slower. Speed is king when it comes to checkouts!3
And ASOS increased their conversions by 50% when they stopped forcing customers to register before they could complete their order.4
It’s clear that taking a few small steps towards a more helpful and less strenuous checkout process could mean major benefits when it comes to conversion.
What’s important to note about each of these examples is that they cater to the needs of their particular audience. By and large, shoppers on Threadless might be looking for a fun and simple shopping experience. Those looking for new glasses on Warby Parker are looking for function combined with design flare in both their eye-wear and their customer experience. And customers making a major appliance purchase on AO want to know they have all their bases covered when it comes to their major purchase, and that receiving it won’t be a hassle. Who is your customer? What are they looking for as they check out?
As web analytics become more sophisticated, we have the ability to understand that even the same customer might have different needs on different visits. The next step in the evolution of a superior checkout experience will cater the process further, to meet customers’ particular needs at the time of their purchase, and make conversion the obvious and simple choice!
I am always on the lookout for UX innovation. If you come across a digital experience that stands out, please send it over to pola.zen@contentsquare.com
1 – https://www.clickz.com/checkout-best-practice-101-guest-checkout/98289/
2 – https://blog.lemonstand.com/9-case-studies-for-optimising-your-checkout-conversion-rate/
3 – https://blog.lemonstand.com/9-case-studies-for-optimising-your-checkout-conversion-rate/
4 – https://blog.lemonstand.com/9-case-studies-for-optimising-your-checkout-conversion-rate/