It’s hard to believe that just seven months ago we were coming out of a record-breaking holiday season, experiencing all-time low unemployment rates, and profiting from high consumer confidence. The stars were optimistically aligned for another successful year for eCommerce. The future of digital looked bright until 2020 took an abrupt turn.
As COVID-19 spread across the world, stores and offices shut, workers went remote, consumers’ spending habits and behavior changed, and some businesses struggled to keep up with change. But through it all, digital was the one constant for consumers. But while digital has always been a rapidly changing industry, the pandemic sent many businesses scrambling to beef up their online presence, capitalize on the new onslaught of digital traffic and keep up with changing consumer needs.
In January, before the pandemic, Contentsquare released a series of predictions for what we expected the year would have in store for the digital landscape. Just like how many things didn’t quite go to plan this year, many of our predictions were accelerated by the sudden need to prioritize digital — things we thought would gain more importance over time turned crucial overnight.
Here’s a look at what we got right:
1. Our Prediction: In 2020, the “experience wars” will heat up.
Start of 2020 Context: As brands continue to compete for customer attention and loyalty both in-store and online, they must do more than just provide a great product or service. Companies can no longer think of in-store and online as two separate entities. They need to take an omnichannel approach to build innovative in-person and online experiences that wow customers no matter where and how they interact with a brand.
What Actually Happened: The pandemic and subsequent shuttering of retail stores across the country brought many industries to a standstill. Companies scrambled to update their online presence, but for many brands, the loss of in-store revenue was insurmountable. Brands like Neiman Marcus, GNC, Brooks Brothers, Pier 1 Imports, and many more filed for bankruptcy.
Many brands were able to get creative and capitalize on the rush of digital traffic. Curbside pickup, virtual try-ons, live virtual gatherings with celebrities and fans, and contactless delivery gave customers new ways to interact with their favorite brands and shop from the safety of their own homes. Brands scrambled to think of innovative ways to win customer’s business, accelerating the future of digital transformation as shifting customer behavior made having an exceptional online presence a necessity—not just a nice-to-have. Successful companies were able to maintain that personalized human touch even without in-store interactions and adapt the experience in real-time to fit new and fast-changing consumer needs.
2. Our Prediction: D2C will become the flagship store.
Start of 2020 Context: 2019’s surge of direct-to-consumer (D2C) brands was projected to continue into 2020. Brands found success in cutting out the traditional retail route and selling products and services directly to customers online—think Casper, Quip, and Freshly. Aside from bringing customers more reasonable prices, many D2C brands seem to have cracked the code around building great, personalized, and value-driven experiences to their customers because they own and analyze every touchpoint on the customer journey.
What Actually Happened: D2C brands’ digital-first mindset prepared them for the sudden dependence on online shopping. While most brands were relatively unphased by store closings, many had to overcome supply chain challenges, deal with slower shipping times, and adjust to changing consumer needs. Even in the face of a global pandemic the future of digital D2C brands looks promising. Market research estimates 2020 D2C sales will grow to $17.75 billion, an increase of 24.3% over last year. Even as stores across the world reopen, Contentsquare data reveals customers seem to prefer the convenience and safety of online shopping, a new trend that might be here to stay.
Non-D2C brands can learn from the end-to-end business approach of D2C brands. Owning the customer journey can give businesses more insight into their customers, their behavior, and their needs. Businesses can also have more control over their brand and build both brand awareness and a community that inspires customer loyalty. For example, while technology company GoPro depends on online marketplaces to sell their products, they’ve also adopted a D2C approach. The company made sure to incorporate inspirational video storytelling to create an innovative shopping experience for its audience of experience-seekers and adventurers. This enabled GoPro not only to increase direct-to-consumer sales, but also gave them more control over the end-to-end customer experience.
3. Our Prediction: Brands will flip the acquisition model.
Start of 2020 Context: Instead of trying to get as many visitors as possible, we predicted brands would put more emphasis on what happens once a customer journeys through their website to better understand who they should be marketing to and how. Brands were beginning to recognize how a strong customer experience can inspire customer loyalty and drive revenue. In fact, a study by Frederick Reichheld of Bain & Company reveals that increasing your retention rates by 5% can increase profit by up to 95%. Instead of pouring money into customer acquisition, more and more businesses will invest in analyzing customer behavior and understanding customer journeys to better serve and target users who’ve already interacted with their brand.
What Actually Happened: Brands slashed their global ad spend by almost $50 billion after the start of the pandemic. That’s more than an 8% decrease in spending, according to the World Advertising Research Center. While traditional media outlets like TV, newspaper, and radio saw the largest impact, online media also took a hit.
Between reduced ad spends, store re-openings, and decreased global traffic, brands have to be strategic to surface opportunities to acquire, convert, and retain more shoppers. Companies need to better understand how visitors interact with their site, identify and improve areas of frustration, and provide relevant, personalized experiences to convert visitors to customers.
Not only do companies need to provide relevant, vibrant experiences, but they need to evolve to meet changing customer wants and needs. This has been most apparent in the last few months as customer preferences have shifted dramatically. Brands have had to be aligned and empathetic to the ways their consumers navigate a health crisis, beyond just shopping for goods.
Even in the face of uncertain economic performance, many brands doubled down on their commitment to corporate social responsibility, by supporting frontline workers, extending help to employees, offering discounts for unemployed individuals, donating to small businesses, etc. Crocs, for example, used its platform to help donate shoes to healthcare workers, donating over 860,000 shoes across the globe. Club Med brought families together by sharing and organizing activities families could participate in from the safety of their homes. The New York Times removed its paywall from all coronavirus content, so everyone could access accurate news on the pandemic. Ford, General Motors, and Tesla converted factories to produce ventilators and medical equipment. The list goes on.
As COVID-19 continues to change the way customers view the world, businesses must focus on the future of digital and continue to show they are mission-driven, compassionate, and socially responsible to win over customers and set their business apart.
While this year has been quite a rollercoaster, 2020 is far from over. While no one knows what else this year has in store for the future of digital and eCommerce, we’re hoping it’s pretty uneventful (fingers crossed).
But, just like how this year has only given us a taste of what it has in store, we’ve only shown you three of our annual digital predictions. For the complete breakdown of the rest of our annual predictions and a look at how COVID-19 has impacted traffic, transactions, and conversion rate across different industries, check out our new “Adapting to The Unpredictable: Using Customer Intelligence for an Always-Relevant CX” Report.
Introducing the New Zoning Analysis: Our Signature Feature is now More Powerful and Easier to Use than EverAfter months of hard work and dedication, our Product team is ready to unveil our new Zoning Analysis with a more complete experience than ever.
So how did Zoning Analysis become Contentsquare’s most-loved feature? The answer is simple. In essence, you get intuitive and flexible visualizations that tell you why visitors engage, hesitate or get frustrated by overlaying key UX metrics directly onto your website.
With these clear business and engagement metrics, it has never been easier to understand and explain differences in customer behavior. With a clear view of what site visitors find engaging and helpful, versus what might be considered obstacles along the user journey, teams can quantify their content decisions at a glance, and easily get rid of friction. This granular read of visitor behavior also grants brands a way to attribute revenue to their content and UX investments.
What makes all this so practical is that Contentsquare’s single tag captures every single customer interaction, including every click, scroll, hover and swipe. The platform automatically captures behaviors on dynamic content and historical versions of your site, enabling you to jump straight to your analysis.
In a world where every business is striving to exceed the latest standards of speed, ease-of-use and seamlessness, we believe digital CX stakeholders should also enjoy an optimized user experience. That’s why we’ve now made your favorite power tool for in-page analytics even smarter and easier to use.
Say Hi to Our New Zoning
Having worked closely with our customers on a solution that provides answers to real-life use cases, we’ve completely revamped our Zoning Analysis so teams can answer questions faster and even more efficiently.
The new Zoning Analysis is even more tailored to our operational goals: fast and easy to use.
Agathe Orsoni, Digital Marketing Manager at Petit Bateau
We made Zoning Analysis inside the platform as quick and easy to use as CS Live, our nifty browser extension. With our Live Zoning, your website becomes your dashboard. Simply browse your site including dynamic content and drop-down menus, overlay metrics in one click and answer questions on the spot.

Need to dig deeper into the data? Take snapshots to save them into Contentsquare, analyze any element of interest or track its progress regularly.
Comparison Made Easy
Let’s say you recently launched a new campaign and want to analyze the performance of your hero banner before and after adding a new promotional offer. Or, you just performed an A/B test and want to compare different A/B test elements side by side. By comparing the two, you immediately see why one version performs better and can take actions based on your visitors’ preferences.
Spot a win or a decision you want to celebrate? Simply export your analysis as a PDF to share with key collaborators, whenever you need.
“The intuitive new Zoning allows us to make more detailed analyses especially on CRO / AB Testing subjects where all test variations have to be studied. The new side-by-side functionality allows us to compare the data of each test variation more easily and to learn the best lessons.”
Hazel Dinler, CRO Analyst at Sephora
Ease of use and speed to insights are the key pillars of our new Zoning Analysis. At Contentsquare, we believe in making decisions based on data, not opinion. And we think this level of customer intelligence should be accessible to all. Zoning Analysis was designed to be used by everyone — its highly visual metrics can be leveraged by anyone, not just analysts, and allows everyone on the team to pursue shared goals autonomously.
If you want to learn more about our new, improved Zoning Analysis or if you’d like to see it in action, we’ll be happy to give you a tour!
Sheltering In Leads To Home ImprovementTo provide understanding during this uncertain time, we are monitoring the impact of coronavirus on online consumer behaviors. See the latest data on our Covid-19 eCommerce Impact data hub.
After weeks of working from home, working out from home, socializing from home, and doing just about everything from home, data shows that consumers everywhere are in the mood for a little home improvement. With a +22.8% increase in the volume of visits to home decor/DIY stores last week (compared to the previous week), it seems that many have come to the realization that working from your bed is not all it’s cracked up to be.
In fact, consumers have increased the time they spend browsing furniture and home furnishings by +46.8% since the start of the outbreak — the largest surge in browsing time observed across all retail sectors. And looking at the number of transactions, these home makeovers are not just virtual. Transactions on furniture and DIY sites in the UK and US were up +52.3% last week from the previous week, contributing to a +101.4 increase in home purchases since the start of the crisis.
So what exactly are consumers itching to change around the house?
How Towels And Linens Became The New Necessary
The volume of products browsed in the linens / bath linens category shot up +96% last week compared to the previous week, with transactions in this category almost doubling over the same period (+96%). It could be that staring at their bed every day is the push many need to finally get rid of that old duvet cover, or it may be less of an aesthetic decision and more of a practical one.
While 85% of people in America may own a washing machine, legions of renters in major cities like New York don’t, relying instead on laundromats — considered “essential businesses” in many areas of the country. But with millions of people trying as much as possible to avoid trips outside the home, and the CDC recommending you don’t share personal household items when caring for someone who is sick, it makes sense that consumers are looking to increase their supply of sheets and towels.

Home Is Where The Office Is
If you’ve ever subscribed to a furniture store or large retailer email list, your inbox is probably inundated right now with invectives to smarten up your home office. Home office inspiration landing pages and promotions on office furniture have been proliferating the past couple of weeks, and a quick scan of the data shows that consumers are indeed looking to upgrade their work stations.
Visits to pages featuring desks, lighting and tables were up significantly this week from last — in that order (see table above). Those three categories also accounted for the greatest increases in the volume of purchases, with a +95% increase in table sales, +92% in lamp sales and +87% for desks.

Spring Has Sprung
For those lucky enough to have a garden or yard to sit or play in to offset cabin fever, it’s hard to not notice that, even during a global pandemic, plants will bloom in April. Pages featuring garden items and outdoor furniture got +33% more attention this week than last, and the volume of transactions on these items was also up +33%. And with supply chain issues becoming a regular occurrence on grocery stores around the world, victory gardens are making a comeback.
Other product categories that are seeing more traffic and purchases include kids’ room decor — +16% increase in volume of products browsed and +44% more purchases this week compared to last. And purchases of sofas and armchairs have also recorded somewhat of a surge, with a +66% increase in purchases from the previous week.
The growing interest in home furnishings and decor is very much in line with the generalized surge in eCommerce traffic and transactions recorded in the past couple of weeks. Total traffic across sectors was up +3.2% last week from the previous week (+10.3% since the start of the crisis) and transactions were up +18% (+32.6% since the start of the crisis). As consumers navigate a new reality without access to brick-and-mortar shopping, their reliance on digital is now almost entire, and for many brands websites are adjusting to becoming the only store. And with the overall conversion rate up +82.6% since the beginning of the outbreak, the home decor sector seems to be carving out its place as one of the necessary digital businesses.
Join our webinar next week, From Convenience to Necessity: How the Coronavirus Is Impacting the Grocery Sector, featuring our Chief Strategy Officer Jean-Marc Bellaiche, this insight-packed webinar will share our latest findings on customer behavior and how the grocery industry is adapting to the new reality — April 16th at 1 pm.
Impact of Coronavirus on eCommerce: Consumers Settle Into Quarantine (Update 4)
To provide understanding during this uncertain time, we are closely monitoring the impact of coronavirus on online consumer behaviors. Find all the latest insights on our Covid-19 eCommerce Impact data hub.
As more and more cities and regions across the world adopt lockdown and shelter-in-place measures, digital consumer patterns are once again shifting to reflect new needs and ways to adjust to an altered reality.
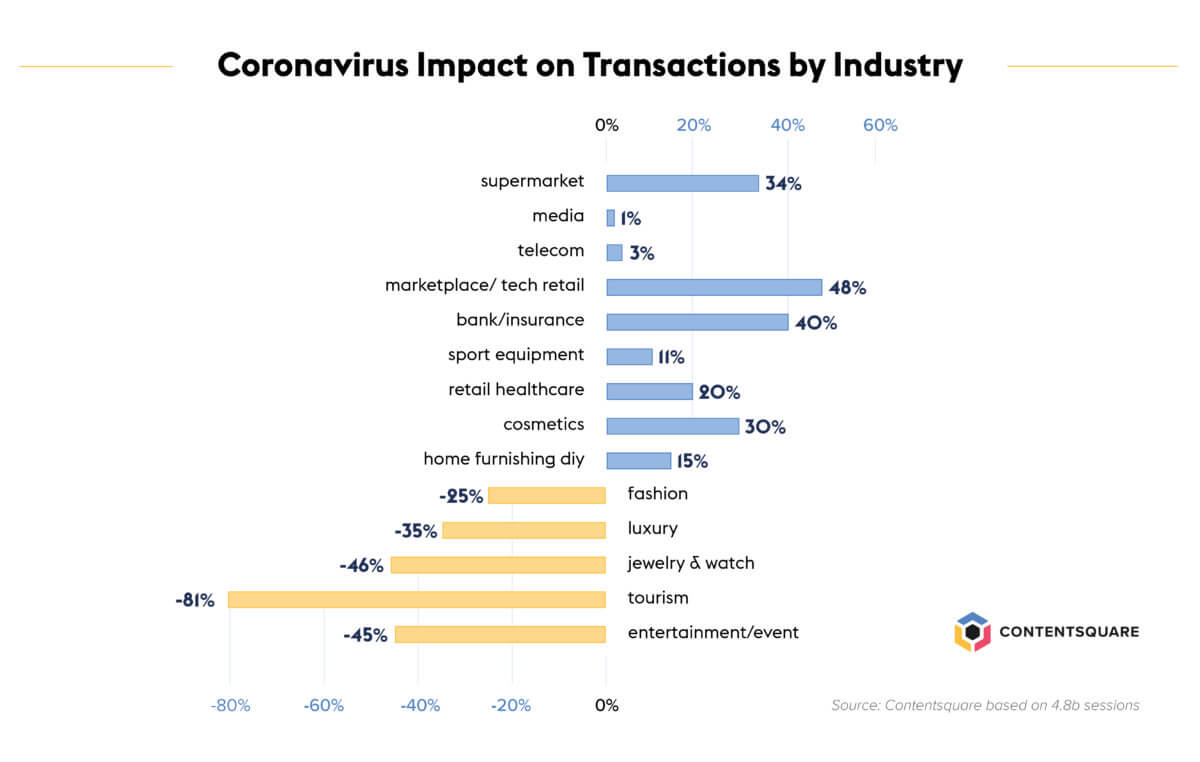
We’ve been analyzing billions of user sessions every day to bring you week-by-week updates on global browsing behaviors across industries. We have broadened our approach to include more than 4.8 billion sessions and 23 billion page views over the last 12 weeks of 2020, from January 6th 2020 to March 23rd 2020. To understand how the fast-evolving situation has impacted global eCommerce, we’ve compared recent weeks to the period immediately preceding the global reporting of the outbreak (or, the first 6 weeks of the year which we call the reference period).
In last week’s update, we referenced American psychologist’s Abraham Maslow’s hierarchy of needs, illustrated as a pyramid, with the lower tiers covering the most basic of needs, including food, safety, social needs etc. What we observed this week is that, after focusing their efforts on securing the most basic of needs such as groceries, health products and financing, consumers have been shifting their online activity to focus on items and services that will help get them through an extended period of isolation.

Online Grocery Stores Struggling To Keep Up With Demand
Traffic to online grocery stores shot up +84% in the last week, contributing to an overall +161% increase in visits since February16. The number of transactions, however, was down -15% last week, in stark difference to the 32% increase recorded the week before. We have observed that in many countries, as consumers increasingly turn to online supermarkets to keep their pantries stocked, delivery slots are running low and some products are unavailable, resulting in a higher number of abandoned carts. At the extreme, in the UK, supermarket chain Iceland has restricted online shopping to “over state pension age, self-isolating and other vulnerable people.”
Retail healthcare clocked in a steady number of visits in the last week but significantly fewer transactions (down -35%), suggesting consumers may have already stocked up on essential medical supplies, vitamins, etc. to last them for the weeks to come.
As some grocery and retail healthcare players experience supply chain issues, it is worth noting that transactions on cosmetics websites were up last week by +33% from zero the previous week. Many beauty players have indeed decided to refocus their offering, with much success, on necessities such as soap and hand cleaning products.
Consumers Get Equipped To Stay Indoors
With a huge part of the workforce now officially in WFH mode, and a great number of children switching to e-learning, many consumers spent some time this week upgrading their hardware. Tech retail sites recorded a +20% increase in traffic in the last week — higher than the total jump in visits since February16 (+15%). The sector also recorded a higher number of purchases than any other week we analyzed, with a +30% increase in transactions. As a comparison point, the week immediately preceding this one had shown no change in the number of transactions.
Visits to sites specializing in books and toys increased +25% in the same period — double the total increase since the start of the outbreak. As parents everywhere contemplated weeks of homeschooling and indoor play, the number of transactions followed suit, with a +140% increase in the last week only.
And despite a -2% dip in the number of visits, sports retailers saw a +30% increase in the number of transactions this past week, a significant increase compared to the changes recorded in previous weeks. As social distancing measures limit people’s ability to go to the gym or take part in group sports, consumers are making sure they have the right equipment to keep up with their fitness regime at home. This is true in particular in the US with more than 60M American members of a gym club now in need to work out from home!

Traffic to Media and Streaming Sites Peaks
Visits to TV/streaming sites went up +34% in the last week — almost three times the increase recorded during the previous week, and +43% since the start of the outbreak. Transactions for the sector doubled week on week, with a +108% increase over the previous seven days.
Media sites continue to record a weekly traffic increase (+24% this week), steadily adding up to a +80% increase since the start of reporting.
Connectivity has taken on a whole new importance in people’s lives over the last few weeks and the telecom sector is continuing to see its traffic grow. The +7% increase in visits to telecom sites this last week is half the spike in traffic observed three weeks ago, implying many customers have now made sure they are properly connected to weather the next few weeks or months.
Tourism and Real Estate Continue to Suffer
Following three weeks of relative stability and a slight dip two weeks ago, the real estate sector recorded a huge dip in traffic this past week — -46% compared to -52% since the beginning of the outbreak.
The travel and hospitality sector continues to experience a slowdown in traffic, which was down – 44% last week. Transactions were also down -67%, contributing to a decrease of -81% since the start of the crisis. Luggage sites followed suit, with a -42% decrease in visits — the biggest drop since we started our analysis.
Meanwhile, visits to fashion and luxury sites were down approximately -15% this past week, and apparel sites in particular saw a -8% decrease in transactions.
For a free walkthrough of the latest data, sign up for our upcoming webinar on March 31st, 1pm. Our CMO Aimee Stone Munsell will be sharing fresh verticalized insights in an effort to help experience stakeholders make sense of the impact we are all experiencing.
Impact of the Coronavirus on eCommerce: Grocery Deep Dive
Since our previous report on the impact Covid-19 is having on global eCommerce, we’ve analyzed billions of digital consumer sessions to understand how people are shopping for groceries and household necessities.
As more cities and countries implement social distancing and restrict all non-essential movements, consumers have been turning to online grocery delivery services to stock up on food and household items.
This latest analysis highlights the shifts in product page reach volume over the course of three weeks:
Week 1 — 2/24 to 3/1
Week 2 — 3/2 to 3/8
Week 3 — 3/9 to 3/15
Traffic to non-perishable item pages accelerates as consumers prepare for quarantine
The number of sessions where visitors browsed canned goods increased +17% between weeks 1 and 2, and a staggering +120% between weeks 2 and 3. As consumers continue to stock up on non-perishable items in week 3, the number of visits to pasta and cereal product pages increased by +75%. Meanwhile, egg product pages got +13% more views in week 3.
We recorded a +2% growth in the number of visits to pages featuring bottled water and soft drinks between weeks 1 and 2, and a further +24% increase between weeks 2 and 3.
Traffic spike for household items and health products
The volume of visits to pages featuring household items increased +33% between weeks 1 and 2, and grew by another +70% between weeks 2 and 3.
Over the same period, the number of sessions that included users browsing health and hygiene items increased +29% (week 1 to 2) and +33% (week 2 to 3).
Traffic increases to produce, meat and fish as consumers anticipate limited trips to the supermarket
The traffic to pages featuring meat and fish products was down -14% between weeks 1 and 2 but climbed +63% between weeks 2 and 3. Visits to produce pages were also down -4% in the first period, before increasing +80% the following week.
We will keep monitoring the data over the coming weeks to bring you timely updates on how events are impacting various sectors. In the meantime, our 2020 Digital Experience Benchmark report is available to download and contains key verticalized insights on how today’s consumer likes to browse.

Since last week’s reporting on 1.8 billion user sessions, we’ve been continuously analyzing digital behavior across key industries to understand in real-time the impact of the Covid-19 outbreak on global eCommerce activity.
By comparing a key set of visitor metrics (including traffic, transactions, time spent, etc) week to week, we’re able to uncover patterns in shifting online and shopping, putting facts behind the digital business trends everyone is talking about.
In today’s analysis, we compare data from billions of user sessions across 1,400 global websites, gathered over the course of three weeks:
Week 1 — 2/17 to 2/23
Week 2 — 2/24 to 3/1
Week 3 — 3/2 to 3/8
The Travel & Hospitality Sector Declines Continue
The traffic and transaction data on travel and hospitality sites confirm significantly fewer visits, with traffic dropping steadily from week to week. Dwindling transactions also reflect the recent travel restrictions and bans, and the general uncertainty over upcoming travel and holiday plans.
Visits to hotel and holiday park sites dropped –6.5% between weeks 1 and 2, decreasing a further 11.4% in week 3. The transactions gap also doubled week on week, with a –5.4% drop between weeks 1 and 2, and an –11.9% decrease in week 3.
Holiday booking sites recorded a slightly different trend, with traffic dropping by –12.9% from weeks 1 to week 2, followed by a slighter decrease of –6.4% in week 3 so customers main remain optimistic the situation is temporary. Transactions took a definite downward turn, with –19% fewer transactions from weeks 1 to 2, and a further –11.3% dip in week 3.
Meanwhile, traffic to car rental sites went down –13% in the first period, and –7.4% in the second. Transactions dropped by –8.3%, and then again by –9.2% in week 3.
Consumers Are Stocking Up On Necessities & Health Items
Reports of panic buying, empty shelves, product shortages and even store-imposed limits on certain purchases have been flooding the news. Our analysis shows that in the digital world, consumers have also been flocking to stores to stock up on essentials.
Traffic to grocery stores went up 7.1% between weeks 1 and 2, and another 10.3% between weeks 2 and 3. Transactions shot up 15.7% in that first period and increased a further 10.9% in week 3.
Visits to premium grocery stores — which initially went up by 4.7%, but in the second week period dropped by –6% — reflect the trend for stocking pantries with necessities. The number of transactions confirms this back to basics with week 3 recording a –20.7% decrease in sales, after an initial increase of 19.9% in the previous period.
But it’s not just groceries people are ordering in.
Visits to healthcare sites (think health food stores, vitamin stores, etc) went up 11% between weeks 1 and 2, and a whopping 24.6% between week 2 and 3. Sales rocketed by 27% in that first period, and 7.1% in the following week.
Social Distancing & The Impact On Digital
As officials restrict gatherings in certain regions of the world, and major sporting events get suspended, individual consumers are also spending less time on sites related to outdoor pursuits and more time consuming digital media.
Traffic to sporting goods stores went down –18.3% between weeks 1 and 2, and dropped again by 11.3% between week 2 and 3. Transactions fell –23.1% in that first period and –13.5% in the following period.
Our analysts also noticed that visits to footwear sites dropped slightly in the last few weeks (by –4.2% in the first period, and –1.8% in the second), with sales following suit and dropping –11.1% between weeks 2 and 3.
Visits to retail tech sites, on the other hand, grew from week to week: 11.5% in the first period and 5.5% in the second. Transactions also went up by 12.7% in the first period and 4.5% in the second. Again these figures reflect a greater reliance on technology as more meetings turn remote and people adapt to shifting working conditions.
Meanwhile, visits to media sites (news, tv, radio, etc) shot up 16.8% in the first period, and 14.2% in the following period. Tellingly, the number of hours spent on these sites increased by 22.1% between weeks 1 and 2, and by 13.9% from week 2 to 3.
Ironically we noted a change in trend for B2B Saas: traffic to B2B SaaS sites was down –5.7% between weeks 1 and 2, but shot up by 11.8% between week 2 and 3, perhaps reflecting a growing need for businesses to boost their digital strategies as more and more purchases, events, meetings and transactions shift from offline to online. The number of hours spent browsing these sites went up by 5.8% between weeks 2 and 3.
We will keep monitoring the data over the coming weeks to bring you timely updates of how events are impacting various sectors. In the meantime, our 2020 Digital Experience Benchmark report is available to download, and contains key verticalized insights on how today’s consumer likes to browse.
Hero image via Adobe Stock, by chonlatit
Balancing Content and Product Investments for Retail BrandsThough an obvious goal of a business is to sell, the customer experience (CX) expectations that consumers have are not as obvious. Particularly in a landscape that is defined by digital innovation, it can be hard to keep up with shifting CX expectations. Customers place a high amount of interest in value — whether it’s the value of convenience, economy or sustainability — and that’s often on top of the product itself.
A retail brand’s challenge in the digital space hinges on balancing content investments versus product and merchandising decisions. While any marketer can argue in favor of the value of content, businesses are often concerned with the evaluation of its ROI.
When a brand invests in content and pushes a large message, it is not always with a strict “purchase” agenda. The message could be emphasizing a directional change, new mission or in some cases, an explanation to customers. What is difficult to measure is if this content has a positive, long-term halo effect on conversion.
So what is the real value of content & how do you stay find the right balance to drive sales and repeat purchasing?
Three Methods for Approaching Content
Retail brands exhibit three major forms of tackling content:
Approach 1: heavy content with few, but staple, products
Approach 2: very little content, but a vast product inventory and customer reviews
Approach 3: balancing content and product within the same site page to drive engagement
Smaller click-and-mortar, or digitally native brands, are able to master the challenge of approach one, prioritizing content over product. With less inventory to showcase, a strong focus on (often inspirational) content allows a brand to distinguish itself and create a loyal customer base. These brands are able to capitalize off of the staple products they’ve created, and create deep connections with a targeted audience.
For example, Away, a digital luggage company, uses a content heavy approach. This brand positions itself by highlighting lifestyle, with content around everything one might need for traveling and nothing unnecessary. Their content identifies with a variety of travel personas, while also considering travel standards. Their content directly states their product solves real travel pains. By the time a user navigates to the product page, they’ve learned enough about Away to ensure this purchase will improve their travel experience. The sleek and modern designs do not hurt, either.
The second approach, product-first with very little content, is present in larger retailers, those with a seemingly endless inventory. These businesses reap large revenue. Amazon, the world’s largest online marketplace (and seller) caters to a variety of retail sub-verticals without much content, but rather, a reliance on customer reviews.

Adob Stock, via kathayut
Balancing Product Prioritizations and Content Creation
There are plenty of brands, including our own customers that take the third, middle-of the-road approach. To find the right balance between content and product, there’s a solution; measure the performance of your content. Once you measure content and segment audiences properly, you’ll have a better understanding of what content is driving purchasing across which customer profile.
If you can draw the lines between customer engagement, conversion and revenue, and answer how to measure the ROI of specific content elements, it removes the guesswork and fear of making content investments.
This safety net allows you to go bold when you measure the success of each content element, with the agility to test different versions or remove the content altogether. You will also answer the looming question of yes or no: whether content has a correlation with product sales.

Adobe Stock, via beeboys
The Verdict
When making investment decisions for content against product, you need to determine whether your content — or any proposed content — is complementing or detracting from your product. Unfortunately, there’s no single best practice for every brand.
Content is a longer term engagement than promotions, because a sale may lead customers to come to your site once or intermittently. The goal of content is different, with the intention to drive repeat visits, purchases, and ultimate loyalty.
Content can be engaging, but without substantial or trusted product behind it, there are no sales. And yet product is not always standalone — it may involve storytelling, materials, or qualifications to encourage a customer to add-to-cart. In either case, analytics is the connection between content performance and revenue objectives.
How bold can you go to allow your brand to shine? That’s something only granular behavior analytics can answer.
Hero image: Adobe Stock, va jeler
At Contentsquare, we envision a world where every digital interaction improves lives.
As we spend more and more time online these days, it’s important to us that the user experience and customer journey are meaningful.
But today, the digital world is plagued by poor experiences. Brands have traditionally been unable to deliver the experiences customers want online because they haven’t been able to easily understand what their customers really want. It’s not just about making sure your customers can find the right product pages or the contact us page — it’s much more nuanced than that. Your customer’s changeable mindset and intent can completely change their behavior online, and most brands can’t tailor the experience needed on demand.
But we do believe that brands have the ability to improve people’s lives. Making the time you spend online more meaningful doesn’t have to be impossible — and so our strategy for achieving our vision has always been to empower brands with unique behavioral insights to create better experiences.
To that end, we took the strategic decision to acquire experience analytics company Clicktale in July 2019. While both Contentsquare and Clicktale are rooted in customer behavioral data and insights, Clicktale’s session replay and heatmaps complement Contentsquare’s page zoning and customer journeys capabilities. Today, just 90 days after that acquisition, we are releasing major new capabilities of the Contentsquare platform, which includes innovation driven by the combined R&D and product team of more than 170 innovators strong.
9 trillion reasons to use Contentsquare
Now, we can confidently offer the most complete experience analytics platform on the market. None of our competitors can give you the level of insight into your customer behavior we can thanks in part to the fact that our solution analyses 9 trillion digital interactions every day for each of our customers.
Now, the combined product is the only complete system of insight that offers brands the ability to do all of the following:
- Surface customer behavior insights easily through intuitive visualizations and behavioral anomaly detection, so you never miss an opportunity to improve the experience
- Identify and prioritize innovations to accelerate growth by better analyzing the performance and revenue potential of experiments, content, marketing and merchandising
- Troubleshoot user experience issues, connecting to voice-of-the-customer technology and alerting on abnormal changes in online behavior
- Quantify and predict the financial impact of potential actions you can take to improve experience
- Activate contextual personalization with third-party systems by aligning experiences with actual customer behavior rather than less meaningful attributes like demographics or gender
No other solution can give you a better level of insight to help you understand and create insight-driven innovation.
Into the future — where our product will sit within the customer touchpoints ecosystem
Improving any kind of digital experience, whether it’s on desktop, mobile or any other channel, starts with collecting the right kind of behavioral data. Customers behave differently depending on the touchpoint you interact with them on, and so it’s important to measure precisely how those customers are using your channels so you can tailor the experience accordingly.
And behaviors won’t necessarily stay the same over time, either, so simply analyzing behavior just once won’t be enough. You need to continuously measure behavior over time so you can tailor your experience to whatever nuanced behavioral changes your customers portray.
But the touchpoints themselves are starting to evolve. In the next three years or so, we’re going to see a shift in the types of interactions between brands and customers. By 2021, experiences will be more conversational, mobile, personalized, social and immersive. All these trends are going to transform the customer touchpoints ecosystem, whether it’s the brand’s own digital channels, physical channels, third-party channels or marketplaces.
If you want to create a great overall experience for your customers, you can’t solely focus on your own digital channels like your desktop and mobile sites. You have to provide a consistent experience across all touchpoints and do the marketing basics (like providing the right product at the right price) well. That’s why our vision for our product is to help you with a significant proportion of those touchpoints — beyond just digital.
Once you’re measuring all your channels though, the key, of course, is to unify all that data and product intuitive visualizations so even the non-digital business units in your organization can understand it and draw insights from it. Only then can we start to realize a vision where digital interactions improve lives — when the whole organization is on board.
Those organizations that lead on digital experience tend to see benefits of 3–5x on measures such as lead generation, conversion, price premiums and loyalty as a result of offering a great experience across the board. And customers are more likely to pay a premium price when they have a great experience versus a poor one.
At Contentsquare, we can help you to compete with the digital leaders, and help you gain an insight into your customers like never before. Request a demo to find out how.