Uncover trends for crucial digital KPIs
Access the 2024 Digital Experience Benchmarks Report and Interactive Explorer.
NEW YORK, June 5, 2019 /PRNewswire/ — Contentsquare, a leading digital experience optimization platform trusted by brands like Avon, Kenzo, Sephora, and GoPro, is making its actionable customer behavior insights available to brands through the Salesforce LINK Partner Marketplace.
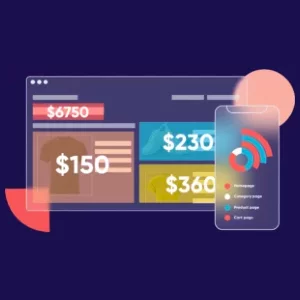
Fueled by intelligence, Contentsquare goes beyond traditional KPIs to give brands a granular understanding of the performance of their web, mobile site and app — down to which in-page elements are encouraging visitor engagement and which are stalling conversions. When paired with Salesforce Commerce Cloud, Contentsquare’s exclusive engagement and revenue metrics (Content Attractiveness, Revenue per Click, Hesitation Time, etc), Salesforce B2C Commerce clients can quickly see how to streamline their product search process, tailor customer journeys, and enhance content for conversions.
Global lifestyle brand GoPro uses Contentsquare on a daily basis as its “source of truth” for understanding customer behavior and delivering inspirational experiences to its community of content-hungry fans.
“I have never been more stoked to see a technology solution like this one that makes it easy for businesses like mine to scale quickly and achieve our aggressive goals,” said Kathy Ando, Senior Director of eCommerce, GoPro. “GoPro.com is stronger, smarter, and more prepared to take on massive digital transformation through Contentsquare and Salesforce B2C Commerce. Our Conversion rate has never been this strong, thanks to the actionable insights from Contentsquare and the flexibility SCC affords us. Contentsquare has armed GoPro with the fuel to propel our velocity and Salesforce B2C Commerce Cloud is our launching pad.”
The Contentsquare integration available through the Salesforce LINK Partner Marketplace provides brands like GoPro an enriched eCommerce management experience. Brands no longer have to toggle between systems to understand visitor behavior in order to troubleshoot issues or zero in on best practices. Valuable input from our common customers will continue to shape our integration roadmap throughout 2019.
With Contentsquare’s full capabilities at their fingertips — including the CS Live browser extension, which displays KPIs directly onto the brand’s Salesforce B2C Commerce site — the entire eCommerce team can leverage highly visual data to quickly prioritize the UX actions that provide the biggest improvements and identify previously unseen opportunities for growth.
“This integration is the natural next step in our mission to democratize access to insight and empower all experience-builders with access to a deep, straightforward understanding of why customers behave the way they do on their sites and apps,” said Jonathan Cherki, CEO and Founder, Contentsquare. “Consumers today want integrated experiences and so do the teams that are working every day to raise digital standards. We are proud that our experience insights solution is available globally on the Salesforce LINK Partner Marketplace.”
Contentsquare experts and members of the GoPro team will be available at Salesforce Connections 2019, the customer engagement event of the year. The ContentSquare integration for Salesforce B2C Commerce Cloud is currently available on the Commerce Cloud Marketplace.
Salesforce, LINK Partner Marketplace and others are trademarks of Salesforce.com, Inc.
Some brands are digitally mature as soon as they come into being. With their appetite for digital disruption and strong data-driven culture, this new crop of pure play brands has been capitalizing on retail’s shift to digital.
Other brands benefit from years and years in the customer service game and have used their physical stores to practice the lessons of customer satisfaction they apply to their digital platforms.
But as consumers increasingly demand an integrated shopping experience, brands are rushing to combine the best of both worlds — the digital-first smarts of digitally native businesses and the personal touch perfected by traditional retailers.
Both models have their fair share of room for improvement and discrete strengths, and digital teams for both types of brands have much to learn from their counterparts.
If you are a pure player, a click-and-mortar or a traditional brick-and-mortar business seeking to break into digital, we’ve got a webinar for you.
In this webinar, we’ll be zeroing in on the following topics:
The webinar will be led by Jean-Marc Bellaiche, our Chief Strategy and Partnership Officer, who has accumulated over 28 years in the industry, having worked for top-name brands such as Tiffany’s and The Boston Consulting Group. He’s also served brands in various verticals, such as luxury, fashion, beauty, jewelry and hospitality, among others.
An expert at generating growth for a breadth of businesses, he will be sharing insights gleaned by analyzing 52 million user sessions, 440 million pageviews and 1 billion clicks.
So are you ready to elevate your digital strategy and master both types of businesses? If so, join us on June 6th at 2 pm.
If you can’t attend, register anyway, as we’ll send you the recording after the event.

Conversion funnel, upper funnel, top of funnel… if your business is digital, you probably hear the word “funnel” several times a day.
If you thought you could ignore it, you’re wrong! Whether you’re selling goods or services on your site, or if you’re using email marketing to reach your audience, the conversion funnel is your friend.
In fact, it’s highly likely that your site has not one but several conversion funnels.
Indeed, all your prospects and customers will not have the same level of maturity and may follow very different paths to conversion.
More than a just a “straight-line” to a sale or subscription, the funnel is a great way to learn about your customers’ browsing patterns and about what the typical buyer decision journey looks like.
Being well-acquainted with its characteristics is a prerequisite for successful optimization and for staying ahead of the competition.
In the following post, we will review some key facts about the conversion funnel and take a closer look at the various stages that make it up.
We’ll keep the best for the end with 9 tips on how to optimize your conversion funnels for optimize your conversion rate. Ready? Let’s jump straight into the funnel.
The conversion funnel refers to the step-by-step process that potential customers go through, from initial awareness to final purchase. It outlines the stages in which prospects are converted into customers, helping businesses understand and optimize their marketing efforts to drive successful conversions and increase revenue.
Spoiler alert: there are almost as many funnels as there are businesses.
The conversion funnel is comprised of the steps a visitor takes to get to a site from an ad or organic search, for example, all the way to a sale.
The funnel metaphor illustrates the gradual decrease of visitors traveling through your site from point A to point B.
The further down the funnel, the smaller the number of visitors, and remember — not all journeys will lead to a conversion. While you will probably have seen many illustrations of the funnel, it’s important to remember that there are almost as many funnels as there are businesses.
Hence the visualization for the funnel will depend on your business objective(s), which could be:
While the funnel is just as relevant for B2B as it is for B2C, it will look very different depending on whether you are targeting businesses or consumers.
For example, in B2C, the funnel will generally be simpler and shorter, because the purchase or subscription is often made on a whim or is at the very least highly subjective. A B2B conversion, however, will often be more pragmatic and business-driven. Building trust over time will therefore be crucial for B2B brands.
2nd spoiler alert: there is no ideal conversion funnel — each objective and target has its own funnel.
Before you even get to conversion, the objective of the conversion funnel is to map out the various stages of the purchasing journey.
Once you have shed light on these stages, you can:
The conversion funnel consists of several stages that customers go through before making a purchase. These stages include:
It’s important to note that the conversion funnel can vary depending on the industry and business model. Understanding each stage allows businesses to tailor their marketing strategies and optimize the user experience for better conversion rates.
Retail, tourism, banking, insurance, online gaming… different verticals will have radically different conversion funnels.
It is, however, possible to map out an outline that will be meaningful to more than one type of business. This outline generally follows four key stages. But don’t forget that, depending on their level of maturity, it is not unusual for a visitor to skip a step or two.
For example, they may decide to complete a purchase without seeking out further information because they are already familiar with a brand and or a product.

For this first step, answer the questions that your visitors might have and build awareness around your product and brand. Make sure that your landing page displays content that clearly addresses the value around your product or services. In short, be educational.
This second stage is all about trust. Your objective should be both simple and complex: obtain your visitors’ contact information either to stay in touch or personalize the experience. This is what is known as lead nurturing.
A great way to expand your database is to be generous with your resources:
The third stage is critical.
Your prospect is shopping around for the most competitive offer and the one best suited to their needs — up to you to stand out in a crowd.
You can do this by:
You thought conversion was the last step in the conversion funnel? Not quite. The next step is to turn regular customers into loyal, returning customers.
This has two challenges:
How to Optimize the Conversion Funnel in 9 Key Steps
Are you still with us? Great — you’ve just made it through Stage One in real time.
Because we really want to get you through to Stage 2, we’ve compiled 9 tips to optimize the sales funnel, whatever business you’re in.
This seems basic and yet… Whether it’s free or not, your offering is the basis of your conversion funnel(s). For example, Amazon rewards its most loyal customers with free or fast shipping and an extended catalog with its Prime offering.
Defining your brand offering also means highlighting unique events around it — for example, a members-only sales to launch the holiday shopping season.
Without a final objective, it will be difficult to map the route from start to finish — from the entry point to the post-conversion follow-up. It’s crucial you determine the main purpose of the conversion funnel in order to optimize the various stages leading to the end goal.
This could be a sale, download, subscription, social share, etc…
The Mindset methodology goes beyond traditional personas to deeply understand your prospects’ state of mind at each stage of the funnel.
Why are they on your site (information, purchase, comparison)? What is the context of their browsing (on mobile, at work, in the subway, in-store)?
Understanding your visitors’ mindset is the first step to making them digitally happy and turning them into converting customers.
Let’s not beat around the bush. Without relevant content, your strategy won’t hold up.
Give visitors resources that provide a concrete answer to their challenges:
In the travel industry, for example, inspirational content plays a key role in keeping visitors interested. This could mean suggesting itineraries for specific destinations, organizing trips around themes or offering advice about the best time to travel to a certain destination. In fact, 40% of all pages viewed* on travel sites contain inspirational content.

You might have the most attractive offer on the market and the most fascinating content, but your efforts won’t go far unless the user experience matches the expectations of your… visitors.
Here are a few common friction points you can fix as a matter of priority:
It’s a well-known fact that load times can heavily impact conversions. A study published by Google in February 2018 indicates that visitors are 32% more likely to leave a site if the page takes between 1 and 3 seconds to load.
It’s a saturated market and your offer and prices are fairly close to that of your competitors… If this is the case, reassurance elements could make all the difference, especially when it comes to decision making.
Make sure information and prices are clear:
As we’ve already mentioned, while objectives and targets are paramount factors of content creation it’s also important to build your strategy around the various channels that lead visitors to your website.
These touchpoints should be top of your mind when ironing the creases out of your purchase funnel:
You’ve put a lot of thought into your conversion funnel, your online content and your UX. Now what?
Now’s the time to analyze your traffic, bounce rate, click rate, session duration, conversions and exits at each stage of the funnel to identify any unanticipated obstacles to conversion. When armed with this knowledge, you can now test different variants of the funnel, modifying the copy, images, or repositioning CTAs, menus or customer reviews and seeing how this impacts conversions.
In conclusion, whatever goods or services you are offering online, conversion funnels are crucial to turning prospects into hopefully, loyal customers.
But building a conversion funnel is not enough. You have to underpin these efforts with a smart segmentation strategy and analyze the behavior of customers as they move closer to the end goal.
Here at Contentsquare we’re obsessed with the way people interact with digital platforms, and that’s why we’ve created a solution that empowers teams to optimize each phase of the buyer decision journey and maximize conversions.
We also believe sharing is caring so pay attention to this blog for more UX advice. 🙂
* Source: from a Contentsquare study based on 188 006 236 browsing sessions captured between October 1 and December 31st 2017.
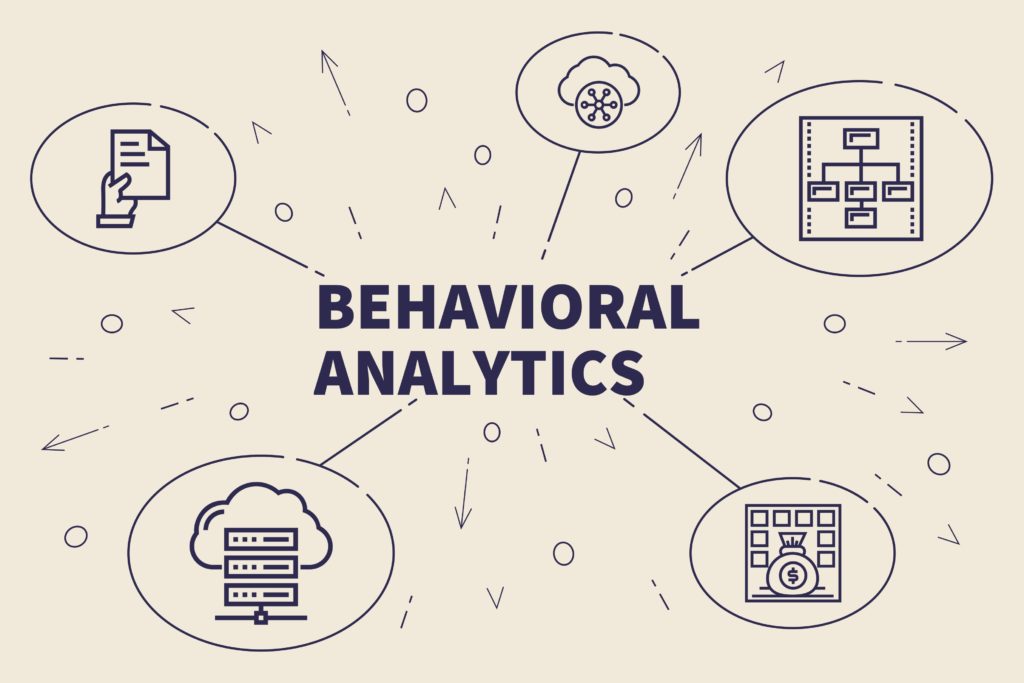
Analyzing Visitor Behavior For Conversion Rate OptimizationYou’re probably aware of the weight that analytics carry in your overall marketing executions. While quantitative analytics solutions give you a good indication of what is happening on your website (conversions, bounces, etc), they don’t present a granular understanding of your customers’ user experience. And when it comes to conversion rate optimization (CRO), the more you know, the better.
Behavioral analytics put forth a deep reading of how visitors interact with individual elements on your web, mobile site and app. By tracking advanced KPIs, behavior-based solutions allow you to discover high points of friction and hesitation, which traditional programs analytics do not offer. They also reveal the areas of your site that contribute to engagement and conversion goals.
Let’s take a gander at the more latent analytics waiting to be used at your disposal for CRO.
In the context of website and mobile analytics, behaviors and their derivative behavioral analysis can be narrowed down to a few quick, yet vital actions that users take on your website.
So what are behaviors in the context of site analytics? A behavior is a navigational action made by a user that gets recorded by a tag. Such an action can be culled and accessed as part of a UX optimization strategy to improve a website’s conversion rate. Behaviors can include page views, clicks and hovers (to name a few) — with each event painting a nuanced picture of how your site is used.
Since 90% of behaviors occur between clicks, a true observation into behavior would require looking at the behaviors beyond clicks alone. These include the behaviors not limited to a single action, such as frustration, hesitation and engagement.
Being able to understand the customer story behind behaviors is key to rolling out the improvements that will have a positive impact on engagement and conversion rate optimization. Clicks, for example, can signify both interest AND frustration — what matters is figuring out which it is.
The first step of a behavioral analysis is to identify where on your site lie the biggest issues and opportunities. This comes from surveying the customer journey. This journey grants a step by step view into how visitors traverse across your website, mobile sites and apps. You can see all the pages users have visited to put together the story behind their digital journey: where they leave and what has led them to conversion. These paths make up the user flow, a crucial aspect of UX that gives you a clear vantage point to the visitor’s intent, which is much-needed to landing conversions.
For example, a site visitor may be on your site for a number of reasons: to window-shop, check out their local store’s opening hours, add a promotional code to a cart to see the price difference, etc.
Customer journeys are visualizations that shine a light on user intent — vital information when you’re trying to develop a customer-centric digital experience. Understanding customer intent will help you optimize your content and know how to best guide visitors down the conversion funnel. It’s also the cornerstone of a satisfying experience, which itself is a guarantee of long-term customer loyalty. If visitors do not convert on their first go, a good UX will spur them to in future visits.
For example, a number of airlines have earned a negative reputation due to their substandard customer experience. But their low prices have gained them the ability to capture a solid customer base. Airlines that offer low prices coupled with good customer experiences (including digital) will undoubtedly give these shoddy airlines a run for their money due to their competitive edge.
Customer journeys present you with a detailed view of where your visitors drop by on your platform, a function that allows you to see where they enter, where they head to next and all the pages in between exits and conversions. Viewing them will help you understand how your site is being used and how to optimize these journeys to ramp up the conversion rate.
For example, if the bounce rate for a landing page is at 60%, a behavioral analysis will provide insight into why visitors are bouncing. This is because it shows you what users do on a page before they bounce, which you ought to look at to make the proper optimizations.
Other issues affecting conversions can manifest as repeated attempts on a payment or login page. This suggests a struggle and thereby, frustration within users. Identifying this is a must in order to improve the conversion rate.
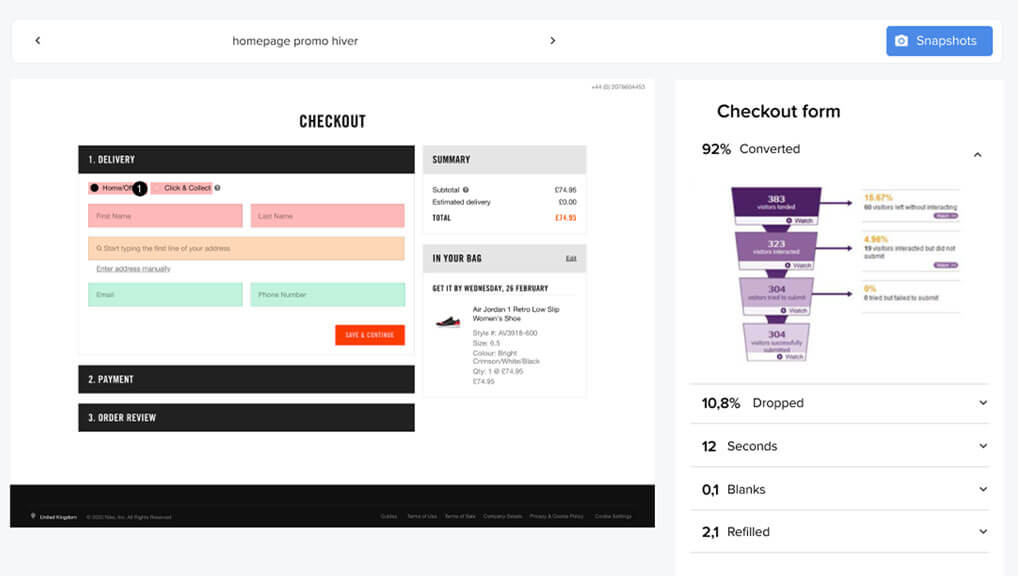
Now that you’ve identified your most critical opportunities and issues, the next step is to answer why they are happening and how you can improve. That’s where we dovetail customer journey analysis with zone-based heatmaps, as they perfect the heat map with a more granular measure of digital behavior. Traditional heat maps appear as a big blob of colors on a page, showing the areas with the most engagement. They don’t however, give you insight into the performance of each page element.
That’s where zone-based heat maps come to the rescue. Like regular heat maps, zone-based maps are highly visual aides that display the most and least popular places on a site page in different colors. However, they have the added capacity of gauging each site element, so you can understand how visitors interact with each one, and what role they play in the overall customer experience.
To do this, zone-based heat maps are numbers-based, so along with the colors, they display attribution and performance metrics, such as click attribution, time spent on each element, conversion rates, revenue per click, etc.
Having this information on hand can help teams pinpoint precise areas of hesitation and engagement, allowing them to carry out targeted, data-backed optimizations. For example, rethinking the location of an image that visitors find attractive but is hidden beneath the fold can have a positive impact on revenue.
What’s more is that today, teams don’t even need to tag elements manually, thanks to the technology that scans all your site elements with precision, identifying CTAs, photos, text, carousels and other content in the process. This kind of smart technology is far ahead of the kind you’d get with a traditional analytics solution.
Behavioral analytics has the capacity to determine not just where people visit, but to also reveal what feelings individual elements of content trigger within visitors.
One of the things it can reveal is if and where users are hesitating on your website. You can leverage hesitation time, a metric that relays the average time elapsed from the last hover to the first click on a zone, which shows you whether your content is easily understood, or if it causes users to hesitate. Understanding this gives you a data-backed picture of the content that stalls visitors — crucial knowledge when deciding on where to optimize the UX for better conversions.

Scroll behavior is crucial to evaluate in order to optimize conversion rates. A user’s scroll behavior depicts which part of a page garners engagement. When analyzing scrolling behavior, you can surmise that users are scrolling when they read something or are in search of a particular piece of information. In either case, there exists some level of interest in your content.
This behavior allows marketers, along with web designers to comprehend exactly how to tinker with page length, or the length of an in-page element that has a scrolling function. In short, scrolling behavior provides context into the impact of longer content. This is especially important for conversion rate optimization, as many scrollable elements lead to CTAs.
Scrolling behavior can be analyzed by way of exposure time, which you can use to see the elements users are scrolling past, to see if they are missing or ignoring a particular element. Or you can also refer to exposure rate, which reveals how far down users are scrolling on a page on average.
This can help you uncover real gems under the fold — areas of the page where visitors who scrolled far enough stopped to linger and engage with the zone. This insight, combined with the hover to conversion rate, can highlight highpoints of visitor engagement that would benefit from more visibility.
Conversion rate optimization can be bolstered by creating engaging content, but no matter how well you think your content is faring, it has to be measured for its efficacy. Traditional analytics fall short here because it cannot distinguish whether an abundance of clicks conveys positive engagement or frustration. Fortunately, there is a formulaic way to measure user engagement.
With the engagement rate metric, you can determine how intuitive your site elements are, i.e., how well users are able to understand how they work and what they do. The metric is calculated by dividing the number of page views who click on a zone by the number of page views with a hover on the zone. This represents the percentage of visitors who clicked on a zone or element after hovering over it.
Clickable elements, especially those that lead to conversions, should have high engagement rates, as this metric essentially shows if a zone has good affordance in light of clickability. So you should make all the aspects of the zone underscore that it’s clickable. This metric will show you if you need to make any changes to such site elements.
The engagement rate of an element can also be used to guide you where on a page to place an element. For example, elements with high exposure and a low engagement rate show that while visitors see these elements and are hovering over them, they don’t click.
Such a scenario reveals either confusion or a lack of interest in users. Thus, this insight points to the need to clarify these elements, i.e., they should clearly show why users should click on them and what they’ll see when they click.
Performance targeting comes from a kind of competitive analysis, one that brings you a side-by-side comparison of content element performance and the like. Performance targeting provides data and insights on how your website is performing against industry averages, essentially showing you the behavioral standards sector by sector.
Additionally, it scraps the need to scout out analytical sources of industry averages, which are not readily available to the public. Performance targeting puts various benchmarks on display for comparison (such as engagement, conversion and revenue). Additionally, it provides insights into content element performance — average locations and sizes for common site elements like the search bar, menu and homepage hero banner.
Lastly, it shows the typical behavioral standards on websites in a particular industry. This allows you to determine exactly what type of content to target and how to modify for better engagement and CRO.
Collating analytics should — and usually does — involve examining the most relevant metrics for conversion rate optimization. These bits of data will help you configure the best practices for the UX, as well as weed out the harmful elements of your website. But common behavioral analyses and their corresponding metrics like bounce rate and conversions are not enough, certainly not for conversion rate optimization. To tap into the minds of your site users and potential customers, you need to employ a unique behavioral analytics solution, which provides additional data-based perspectives and a slew of insight that will prove invaluable for conversion rates.
Conversion Rate Optimization (CRO): Calculations, Measurements & Best PracticesConversion rate is the KPI of all KPIs. It directly impacts a company’s pipeline and revenues, making it the most important metric for most digital marketers and their businesses. However, according to MarketingExperiments, only about 22% of businesses are satisfied with their conversion rates.
Addressing this dissatisfaction is where conversion rate optimization (CRO) comes into play.
In this post, we’ll teach you the basics of CRO: From what a conversion is and how it’s calculated to what makes a good conversion rate, defined against industry benchmarks.
Conversion rate optimization (CRO) is the practice of increasing the percentage of people who take the desired action on your site. This conversion could be anything from making a purchase or adding an item to cart to signing up for a newsletter or filling out a form.
But a “conversion” doesn’t mean the same thing for everyone. Depending on your business and industry, conversion rate optimization means increasing the number of people making a purchase on your eCommerce site or boosting credit card application form fills on a banking site.
In simple terms, conversion rate is the rate at which conversions occur on a website, mobile site, or app.
The conversion rate is precisely the number of times visitors take the desired action on your site, divided by the total site traffic, the result of which is multiplied by 100 to create a percentage.
| CONVERSION RATE % | = | TOTAL GOAL COMPLETIONS | X | 100 |
| TOTAL WEBSITE VISITS |
This formula applies to various types of conversion, including eCommerce conversions (most often a purchase) and sign-up conversions (webinars, ebook downloads, etc).
Generally, a “good” conversion rate constitutes a percentage that is higher than the average. Averages can vary greatly from one industry to the next, and from one device to another.
We recently analyzed 46+ billion web sessions on 3,800+ global websites to determine average conversion rates for 14 different industries. From travel, B2B, and financial services to fashion, beauty, and luxury—we’ve analyzed it all.
Our data revealed that conversions have increased across all industries —jumping from 1.8% in 2020 to 2.3% in 2022. That’s a 28% increase! These rates differ across each industry, ranging from a low of 0.4% in the telecom industry to a high of 6.8% in both the pharmaceutical and grocery industries.
Uncover trends for crucial digital KPIs Access the 2024 Digital Experience Benchmarks Report and Interactive Explorer.
Access the Benchmarks
| Category | Avg. Conversion Rate |
| Automotive | 0.7% |
| B2B | 0.6% |
| Consumer Electronics | 1.4% |
| Energy | 0.1% |
| Fashion | 3.3% |
| Financial Services | 0.2% |
| Grocery | 6.8% |
| Health & Beauty | 3.9% |
| Home Goods & Furnishings | 2.8% |
| Luxury | 1.1% |
| Media | 0.4% |
| Pharmaceuticals | 6.8% |
| Telecoms | 0.5% |
| Travel & Hospitality | 3.9% |
Overall, mobile conversion rates still have a way to go to catch up with desktop averages, highlighting the need for a stronger CRO strategy for mobile.
| Device | Avg. Conversion Rate |
| Desktop | 3.0% |
| Mobile | 1.6% |
If you’re in a sector where the majority of your conversions come from desktop, try offering your mobile users the option to complete their purchase on desktop (such as allowing them to save items to their account basket on mobile to finish on desktop).
Users love to browse quickly on mobile devices but could be put off by having to fill in more complicated delivery and payment information. Giving them the option to switch will help increase your conversion rate and customer satisfaction (and retention!).
Although some of these rates may seem unfeasible, especially to those who are new to CRO, it is healthy to aim higher, and with the tools available to digital marketing teams today (analytics platforms, personalization engines, etc) the sky is the limit.
There is no one size fits all solution to optimizing your website conversions, because it really depends on your industry and your customers. However, there are multiple tips and tricks that you can follow in order to optimize your conversion rate. Check out a few of our faves:
You might have the most attractive offer on the market and the most fascinating content, but your efforts won’t go far unless the user experience matches the expectations of your visitors.
That’s why removing friction in your experience is key to improving conversions. Why not try the following:
Your customers are impatient and want answers immediately!
So naturally, your site’s performance can have a massive impact on conversions. If your website is slow to load and isn’t user-friendly or responsive, chances are your users are going to bounce.
And it’s a well-known fact that load times can heavily impact conversions. Google indicates that visitors are 32% more likely to leave a site if the page takes between 1 and 3 seconds to load.
To stop that from happening, you need to understand how your website’s performing by running your URL through a site speed testing tool and then, optimizing your Core Web Vitals accordingly.
Benchmark your site performance Get data based on over 2,000 websites measuring 4 site loading KPI’s to optimize your site performance.
 Download
You’ve put a lot of thought into your CTAs, your online content, and your UX. Now what?
Well CRO doesn’t stop there. It’s a continuous process. You have to analyze your traffic, bounce rate, click rate, session duration, conversions, and exits at each stage of the funnel to identify any unanticipated obstacles to conversion.
When armed with insights, you can now test what works to improve conversions on your site and what doesn’t, modifying the copy, images, or repositioning CTAs and navigation menus to see how this impacts conversions.
Tips and tricks are great, but seeing how other businesses in your sector are successfully optimizing their conversion rate can help you emulate similar successes on your own site. To give you some real-life examples here are three CRO hero stories:
The Beerwulf team noticed a high percentage of mobile visitors were landing on a product page and bouncing.
The team realized that critical information like price, product info, and the purchase CTA were hidden below the fold on mobile and Contentsquare data revealed 40% of users weren’t scrolling down the page to learn more. Ultimately, the team moved the item name and price above the product image to help increase conversions and decrease bounce rate.
Using customer journey analysis, the Beerwulf product team also noticed customers were repeatedly navigating between their product listing page and product detail pages to compare the contents of their mixed beer packages.
The team then introduced new functionality that enabled customers to view package details directly from the product listing page, ultimately resulting in a 2.4% increase in conversion rate.
The RingCentral website consistently has a high level of traffic, but visitors did not always convert, and potential customers were dropping off. They needed to understand how customers interacted with their website, to ensure elements of the website were aligned with customer behavior to drive interaction and engagement.
The team had already been conducting A/B testing, but didn’t have experience-related metrics and were unable to consider the website from the point of view of a customer to recognize where the website wasn’t providing an optimum experience.
Using the Contentsquare platform enabled RingCentral to gain a deeper understanding of the entire customer experience — establishing which areas needed to be removed or redesigned, what customers were clicking on or searching for, and what aspects were reducing the probability to convert.
This helped the RingCentral team identify several areas that were ripe for testing and improvement. One such test to the main lead capture form resulted in an immediate 25% increase in conversion rate.
Conversion rate can be determined from two types of visitor journeys to a site, or their arrival at it.
1. Organic keyword search visits and paid search visits
The first category falls upon both organic keyword search visits and paid search visits (ads), while the second category of site entries stems from URL visits, also known as direct visits to your website.
Moulded by the user experience, these subsequent journeys are invaluable for optimizing conversion rates. Those who click on a landing page from a keyword search or social media ad already possess some interest in your offering, since they not only looked up the keyword — or engaged with the ad — but entered your website through the associated link.
Besides social posts and ads, queries on search engines also lead users to landing pages. These are reached in the links below a website’s general search result — typically the homepage — in the Search Engine Results Page (SERP). They usually lead to specific products or pages, reflecting the query.
2. URL-based, or direct visits to a site page
The other type of customer journey is derived from a URL-based, or direct visit to a site page. With URL-based visits to your site, the intent is less clear; some visitors may arrive at it for informational purposes while others may have a clearer objective. Even so, those who visit for the information may not be interested to sign up for your whitepaper, case study, email list or other content.
Obstacles and frustrations in the digital journey will impel your visitors to bounce from – or exit – your site. At worst, the visitors will head to your competitors’ sites. Thus, the experience a visitor has on your site and the way in which it helps them achieve their goal(s) are exceptionally important and must be calibrated to ensure good conversions.
Patience may be a virtue, but who actually has the time for it when you operate a business or work in marketing?
In website development
Since conversions are closely tied to revenue, the first time to think about optimization should come rather early on in your website development.
If it is your first iteration in establishing a website, there are general cautions you should take, such as assuring all site elements are operational, especially the ones that lead to a conversion. So make sure all on-site CTAs, links, form fields and the like work without any trouble.
For example, your business will inevitably lose revenue if the same link remains broken for even a moderate period of time, or during any UX mishap, like the checkout button being buried beneath the fold.
During a site redesign
If you are in the redesign phase of your site, then you should learn from the old or current user experience of your website. Take into account what hasn’t yielded satisfactory results from analyzing your consumers’ behaviors on your previous site.
In SEO & SEM
You should start strategizing for CRO, as the aforesaid conversion rates from organic keyword searches and paid searches already have their own separate sub-discipline for optimizations. They are what is known as search engine optimization or SEO, and SEM, or search engine marketing. The former deals with optimizing organic search clicks, while the latter deals with optimizing paid searches.
Conversion rate optimization primarily deals with optimizing the customer experiences to improve conversions since search-based conversions have their own optimization best practices (SEO and SEM).
Either way, you need to improve visitor journeys so consumers can fulfil their digital goals painlessly.
Monitoring your visitors’ digital happiness is key to keeping your customers engaged and your conversion rate healthy. Improving your user experience will result in longer site journeys, fewer bounces and more positive sentiment, which is inextricably tied to your brand.
If visitors have a poor experience on your site, they’re likely to leave, regardless of how good your product is. Optimizing your website begins with analyzing your users’ behaviors. It’s the only way to ensure a customer-centric CRO strategy based on behavioral evidence, rather than intuition.
Take a product tour Get to grips with Contentsquare fundamentals with this 6 minute product tour.
 Take tour
Analytics today can keep you abreast of any behavioral anomalies and deviations on your site so that you can improve the experience quickly and continuously. Only after you’ve analyzed how users interact with your site — what is effective and what isn’t — can you make results-yielding decisions for CRO.