Uncover trends for crucial digital KPIs with the 2024 Digital Experience Benchmark Report → Access the benchmarks
How Well Do You Know Your Holiday Shoppers? – es
You think you know your holiday shopping? Take this quiz to test your seasonal savvy and see how much you really know!
Now it’s time to roast some chestnuts and check out the 10 Commandments of Holiday Shopping!
The Great Grocery Revolution: How to Prepare for The New Age of Digital Shopping
Amazon’s recent acquisition of Whole Foods has many online grocers quaking in their boots. And while the brand’s increasingly monopolistic growth is understandably daunting, there’s a lot to be gained from observing and analyzing this expansion. Namely: things that work for Amazon might just work for other online retailers, too.
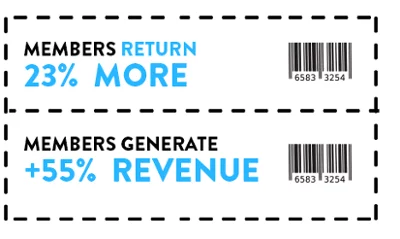
Take membership. Companies like Amazon that offer an attractive rewards scheme for their member users will in turn be rewarded with a higher conversion rate — 10 times higher according to a recent ContentSquare study. Amazon has perfected this approach with Prime — a membership program that has the effect of a conversion multiplication machine. But Amazon doesn’t have the monopoly on membership, and studies show that any business that develops its member base will see more visits, more purchases and more revenue. Our study found that members view 148% more pages than unlogged visitors, and generate 55.57% more revenue.
MEMBERS VIEW 148% MORE PAGES THAN UNLOGGED VISITORS, AND GENERATE 55.57% MORE REVENUE.
And then, of course, there’s knowing your customers. Digital giants like Amazon invest heavily in understanding the needs and desires of their users in order to offer a personalized online shopping experience. But next-gen UX analytics and experience insights offer all digital businesses the tools to interpret why and how customers use their platforms. Understanding could mean anything from letting Bob share his baby shower registry through Facebook, to knowing Matilda likes to pick up her groceries in-store after 5pm. And given that in-store pick-up customers spend on average 6% more than eCommerce customers, this is the kind of data you want to have at hand.
Which leads us to the heart of the matter: digital experience. The digital age is first and foremost the age of convenience. Customers today are unwilling to stick with complicated, clunky platforms. When it comes to sites, they’re looking for simple, sleek and flawless journeys. Forms that take ages to fill out are a massive deterrent. Shipping can also be a hurdle, and evidence shows that shipping costs are responsible for highcart abandonment rates — 28% of shoppers give up on their purchases because of unexpected shipping costs.
We at ContentSquare have developed a platform that provides businesses with reliable and actionable insights into their customers’ digital experience. By flagging friction points and highlighting stumbling blocks along the customer journey, our data-driven solution allows businesses to really focus their efforts when it comes to digital optimization. And a seamless, intuitive platform is a prerequisite to a healthy conversion rate.
To get you started on your journey, we’ve put together a report that outlines everything you need to know and do to compete with the industry trailblazers. We’ve listed some of the online grocery must-haves and don’ts, and folded in some very telling data we collected in an industry study based on over 37 million user sessions.
Welcome to the brave new world of grocery shopping, and help yourself to a slice of the pie.
Halloween UX Horror Stories – Save yourselves!
Halloween is scary. It brings out the zombies, the monsters and the demons. And horror stories. Oh, the horrible UX horror stories. Dare you read on?
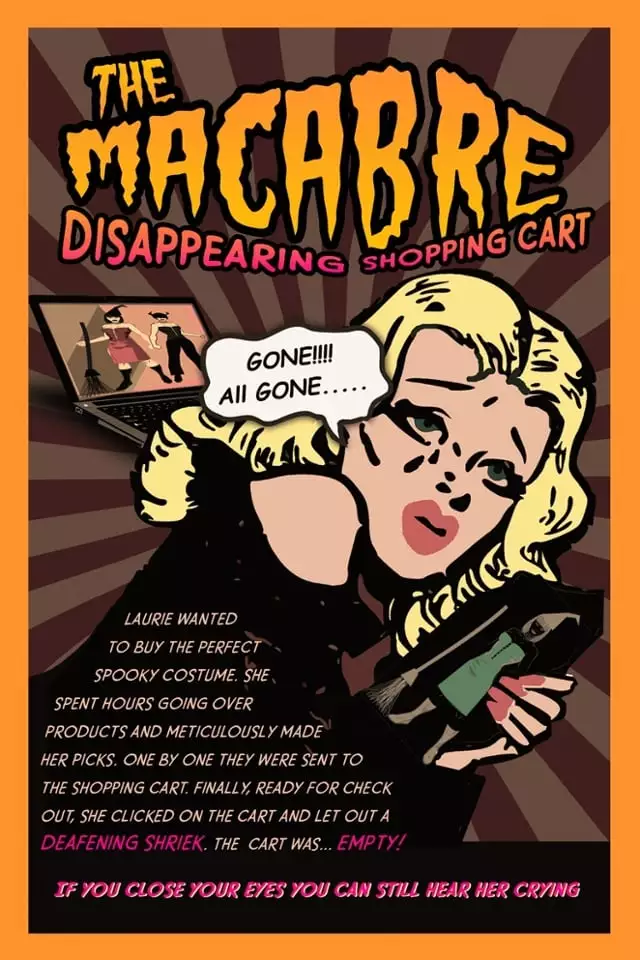
Have you ever taken your time to shop for yourself, select the perfect items, one by one, examining every detail and making sure they are exactly what you want and then… you want to check out… you click on the cart… and it is empty?! THE HORROR! This is Laurie’s story:
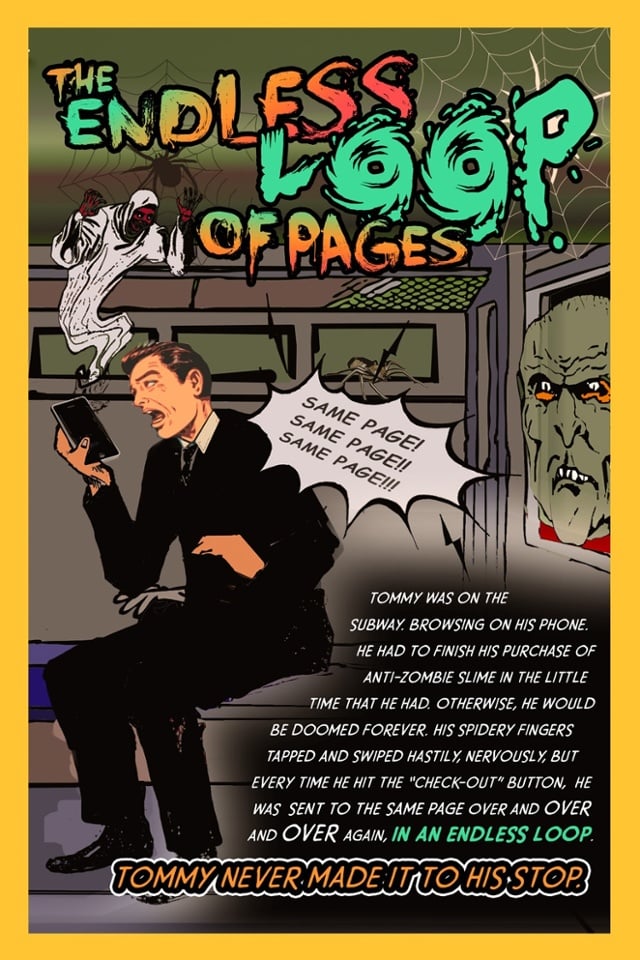
Have you ever been on a mission to find something online, begin your journey and click on the option you want but get an error and get sent to the same page, and try again and again and again and get sent every single time to the same page in an endless vortex you can never get out of? THE HORROR! This is Tommy’s story:
Have you ever created content for a site, worked hard to find the right mix of words, images, rhyme and reason to convey your beautiful thoughts online and published them knowing that with such an amazing effort will come an even more amazing result? And have you then realized that, in fact, no one is reading it, no one is scrolling, no one is clicking and the words are dying a slow and painful death? THE HORROR! This is Linda’s story:
Save Laurie, Lynda and Tommy from these horrors! ContentSquare will give you the digital experience insights you need to understand where people are getting stuck or frustrated, what makes them happy and what makes them howl. No wooden stake, garlic or silver bullets necessary.
Digital Transformation for the Automotive Industry
In 2010, Ford announced that it would start selling its cars online. According to their research at the time, 4 in 10 buyers were ready to buy their next car on the internet.
Seven years later, most automotive manufacturers and dealers are still far from being ready to sell cars online, not to mention consumer expectations which are at an all time high. Yet despite massive investments in digital technology by all the players, there is still little to no understanding of exactly what customers are looking for online.
In our new study dedicated to car manufacturer’s e-commerce, we set out to solve the automotive industry’s online challenges by driving transformation in user experience. A great digital experience will convert more visitors online and help sales managers build lasting relations with customers, both online and offline.
OVER THE LAST SIX MONTHS, INTERNET TRAFFIC FOR NEW CAR TECHNOLOGIES HAS SHOT UP BY 127%!
Today, most customers start their car-buying journey online by researching new car technologies. In fact, over the last six months, internet traffic for new car technologies has shot up by 127%. Yet despite this increase in traffic, only 1% of visitors will actually fill in a form or leave contact details. So why are 99% of online visitors not satisfied enough to leave their details? Classic analytics don’t give you any information on why visitors do what they do. You need the behavioral data, or visitor’s interactions, in order to start making decisions that will move your customer down the sales path.
By uncovering the customer’s journey online, you can begin to understand what they are doing, and how you can help move them down the sales cycle, and bring them closer to your online objectives. These interactions will let you know how the buyer feels on your website, or what the actual user experience is. Hesitation metrics can signal frustration, and waiting a long time before the first click can mean confusion.
OUR STUDY SHOWS THAT 65% OF TRAFFIC IS STILL FROM DESKTOPS.
Our study shows that 65% of traffic is still from desktops. You can imagine a visitor comfortably seated at the computer and wanting to have a look at some new car models. What would make navigation easy for them? Since most visitors know exactly what they are looking for, try playing with the navigation to focus on showcasing vehicles and their features, making it easy for them to progress from the home page to product pages, until they reach the contact form.
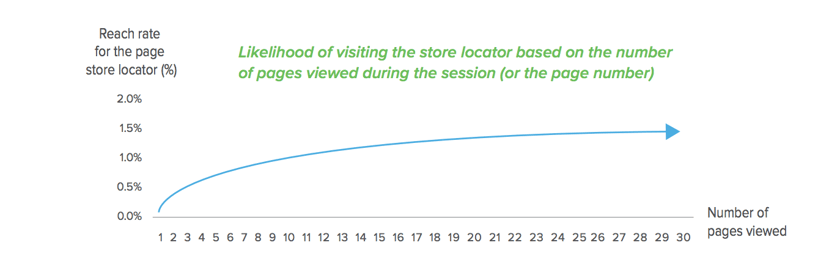
A picture, of course, is worth a thousand words. Here too, you can use the power of images to create a good user experience and increase the likelihood of submitting a form by a sizable 134%. On the other hand, be wary of too much scrolling. Your visitors are looking for very specific information, and they will not scroll through the entire page to track it down. If your bounce rates are high, look at the scroll rate and adjust the location of information on the page. If they do find what they are looking for, that is good news for the site. Our study showed that after the 30th page read, the likelihood of visiting the store locator increases by 35%.
While new car sales still happen mainly in the showroom, there is a clear indication that most people are starting their buying journeys online with research and information gathering. The experience you give your customer on the first page visit will set the stage for the entire customer relationship. Make sure it is a positive one by optimizing your website with a great user experience.
4 UX KPIs You Should be Tracking (But Most Likely Aren’t)
When marketers want to measure their website performance, they often rely on indicators like conversion rates, bounce rates, session duration, or number of page views.
Just like a doctor conducting a routine check-up on his patient, the use of basic KPIs is an excellent way of monitoring your website’s “health” and a good way to find symptoms of bad user experience. Yet, when it comes to understanding the exact cause of these symptoms, and coming up with the right optimization decisions, traditional analytics are simply not enough.
Here’s 4 KPIs you might not have heard of, but that could become crucial to your online business success.
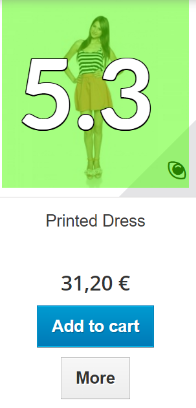
1. Click repetition
What is it ? The number of clicks in a row on the same page element. If this indicator gets past 2, it’s a clear sign that your users are getting frustrated. There could be several reasons for this: design misconceptions, bugs, unclear CTAs…
Let’s look at an example. The screenshot opposite is taken from a fashion retailer’s website. We can see that the image is clicked over and over more than 5 times on average… The reason behind it is that the eye-shaped icon, suggesting you can zoom-in or enlarge the image, doesn’t trigger any action at all. That’s typically the type of frustrating experience you want to avoid on a retail website. Click repetition also often brings to light a very common and underestimated problem for e-commerce websites : the lack of feedback at important stages of the browsing experience. Think of when you put a product in your basket: you’re expecting a confirmation, but what if this confirmation isn’t clear or takes too long to be delivered ? Chances are you click again, and again. You need to ensure that you prevent this kind of negative experience by tracking this KPI.
On a sidenote, be careful not to misunderstand click repetition for “click addiction” as, for instance, users compulsively clicking on a slideshow could trigger the same KPI.
2. Activity rate
When a page fails to meet the needs of the visitors, they usually leave, thus generating a high bounce rate. But how do we know whether this bounce is due to inadequate content or to an interaction problem within the page ?
The “time spent” by users on a particular page could give us a hint, but it could be tricky. Indeed, what we really want to know is if people interact with the page.
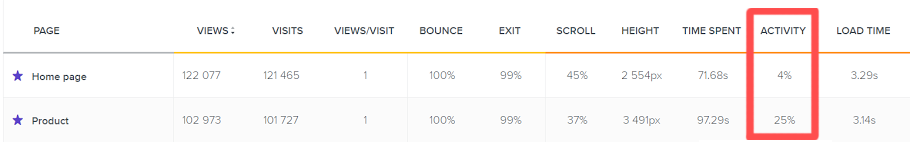
“Activity rate” measures the time spent interacting within the page. In the case of a page with a high bounce rate, a low activity rate would point out a problem in acquisition strategy. To the contrary, a high activity rate would lead us to understand that users leave because the page isn’t responding properly to their interactions. Thanks to understanding the activity rate, you know what to investigate.
On the following image, we see that “bouncing users” leave the homepage without doing anything (4%), whereas on the product page, they interact before leaving (25%).
3. Engagement rate
We can all agree that creating efficient “call-to-action” buttons is crucial to conversion, but it is also an art. A slight change of words can have huge effect on clicks-through. When you need to figure out which CTAs are more appealing to your users, and which ones are less appealing, engagement rate comes in handy.
In the menu below, we clearly see that “Exclusive offers” is by far the most affording category of the menu, with 12. 6% engagement rate.
A low engagement rate would reveal that the wording is unclear, or maybe that two categories seem to describe the same thing.
By monitoring this KPI, optimizing and reorganizing your menus and CTAs for better performance becomes significantly easier.
4. Time before first click
Have you ever wanted to know if your checkout page could perform better ? Assessing the time before click would uncover significant insight into being able to address this.
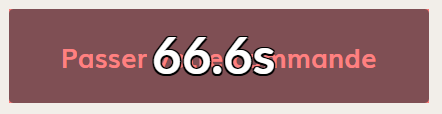
The following two CTAs are checkout validation buttons, taken from two different websites.
On the first website, users take 43.8 seconds to review their checkout list before clicking on “validate”.
On the second website, it takes them 66.6 seconds to accomplish the same action. That’s 23 seconds longer, and yet the checkout page is way simpler in that case. It’s obvious that something isn’t clear and takes time for users to understand.
Conclusion
Advanced UX Analytics are empowering marketers with a new generation of KPIs that offer to show how users really behave while browsing, leaving intuition aside and allowing data-driven optimization. Click repetition, activity rate, engagement rate, time before click are some of the new indicators that help leading retailers minimise errors and hesitation times, equipping leading e-commerce brands with the ability to provide a seamless user experience.
What’s your opinion about KPIs ? Tweet us what you think @ContentSquare
To discover how UX Analytics can help you with your business, visit contentsquare.com
There is Still Time to Catch the Back-to-School Shopper – Study Pinpoints Buying Habits of Late Shopper
The Back-to-school shopping season is one of the most diverse shopping seasons of the year with shopping beginning as early as June, and unofficially ending around Labor Day which has become symbolic as the unofficial “end of summer”.
In our study, “Back-to-School Shoppers – A Digital Behavior Report”, we analyzed these shoppers and determined that people shopping for back-to-school items in August represent the biggest opportunity for conversions. We took data from over 40 million visits and 460 million page views in order to understand this online behavior. Behind these numbers are insights that can have a huge impact on how you sell, insights that our CEO, Jonathan Cherki shared with Inc.
We divided shoppers into two categories:
Early shoppers – from June 1 to July 15
Late shoppers – from July 15 to August 31
Why are late shoppers the biggest opportunity?
Our study shows that late shoppers are much more engaged, and buy fewer items at a higher price. And although our studies showed that late shoppers have lower conversion rates, their average cart value is 35% higher. Now is the time to adjust your site to the late shopper buying habits and convert shoppers for the highest revenues of the season.
OUR BACK-TO-SCHOOL STUDY SHOWS THAT LATE SHOPPERS (LATE JULY = AUGUST) ARE MUCH MORE ENGAGED, AND BUY FEWER ITEMS AT A HIGHER PRICE.
The back-to-school shopper uses both mobile and desktop. The consumption of content on mobile needs to be understood in the context of very short browsing sessions. Most users on mobile are multi-taskers with short attention spans.
For the late shopper, our study revealed that 22% of parents who wait until the last month to purchase their items will use their desktop. A multi-device strategy across all back-to-school campaigns is essential for creating a seamless experience from any device. According to the type of items in their cart, late shoppers also prefer quality over quantity. Take this opportunity to highlight exclusive products in August, as the late shopper will pay the higher price, and pick up on even more revenue from the conversions of late back-to-school shoppers.
The digital journey of the late back-to-school shopper is clearly laid out in our new research paper “Back-to-School Shoppers – A Digital Behavior Report”. With approximately 50 million kids going back to school, and spending to reach $75.8 billion dollars, there is still time to pave the way for back-to-school consumers to finish their shopping on your site.
Read the full report here, and then adjust your site before you swap out your school supplies with upcoming Halloween merchandise that is just around the corner.
Move Over Millennials, There’s a New Kid in Town: Generation Z
Born between 1996 and 2010, some are calling the new wave of consumers the Last Generation, others the Homeland Generation, but we at ContentSquare call them something else: Born to shop. And we’ve created a new eBook to teach you step by step how to connect with them.
This is the first generation of digital natives, raised on technology and understanding intuitively concepts and processes the rest of us had to learn through trial and error. 40% of Generation Z already self-identify as digital addicts. Furthermore, this new wave of internet citizens already commands 44 billion annually in the US alone— just from their allowance!
While this new era is just at the tip of the iceberg of their buying power, they’re already savvier and more discerning on the web than their predecessors. User experience is the language of Generation Z, with mobile and web interfaces their natural habitats.
On the one hand, they’re unforgiving when it comes to clunky or error-filled platforms, with 60% saying they won’t use an app or website that is too slow to load, and 62% saying they won’t use an app if it’s difficult to navigate.
On the other hand, they’re hungry for original, engaging digital experiences, and visit 62% more pages in a session than the rest of the population. Generation Z wants you to woo them, they want you to create a personal, immersive digital world for them to play— and shop— in.
This generation has been largely underestimated or dismissed by the media, but that is a mistake— and a costly one! This choosy, demanding new era already converts twice as much online as the rest of us.
To help you speak the language of Generation Z and capitalize on their buying power by offering a superior online shopping experience, we’ve created an eBook, Generation Z: The Coming of (Shopping Age), your A to Z guide on courting the new generation of consumers. The data is based on an analysis of over 8 million user sessions from ContentSquare data in 2017 across 7 countries: The US, Belgium, Netherlands, the UK, Germany, France and Spain, across a number of industries.
We offer, in this report, all the steps you need to take to attract and engage Generation Z, with checklists of concrete actions you can implement right now. Forbes already praised our emphasis on telling your brand’s story through user experience— are you ready to roll out the red carpet for your new era of shoppers? They are more than ready for you.
NRF 2017, the Three Musketeers of Technology
NRF 2017 has come and gone and it’s a good opportunity to take a moment and reflect on the extraordinary technological capabilities that will soon become a part of our everyday lives, the challenges that we face and what the future holds for technology within the retail industry.
Upon entering the Jacob Javits Center in New York last Sunday one might be a little overwhelmed. With 33,000 attendees, upwards of 500 exhibitors and over 300 speakers, there was a whole lot to take in. But one thing was obvious, that “Technology, People and Process” are the Three Musketeers of the future and all must work hand in hand to generate success.
The Technology and The Challenge
There are periods in history where certain technological breakthroughs have changed the world and we are certainly on the cusp of another such time in history. The invention of the automobile, airplanes, the internet and smartphones all changed our lives and our culture. Automation will soon do the same.
At NRF, I could see so many ways that automation will affect our lives. Merging digital with traditional commerce is the challenge that many companies are facing. And of course, there will be repercussions to automation and the main casualty will be the workforce.
For example, there is a company which is in the process of transforming how we use dressing rooms at clothing stores. They have created an automated system where you can go in a dressing room and scan the item you want to try on, and while in the dressing room you can (with the touch of your finger) change the color, the size and even purchase the item right then and there.
Of course, that will all but ensure that some folks will likely need to find a new position soon. And therein lies the challenge of this technology, there are always casualties. But in every instance in our history,we have adapted and progressed because of these technological breakthroughs and automation will be no different. It’s a technology that we will all embrace soon enough and one that will make all our lives so much easier in the long run.
A few years back, CVS (the drugstore conglomerate) and other retailers started to place self-service check out registers at their stores. I remember there was a backlash and so many were against it. But recent studies have shown that today people would rather use the self-check out than go to a regular register manned by a human being.
I heard a story on the news a few weeks ago, that AMC Theatres conducted a study that showed millennials would rather wait in line to use the self-service kiosk at the movies than to not stand in line at all and buy their ticket from the attendant. My how times have changed, right?
So, this is where “People and Process” enter the equation. We must let people and the process dictate how technology advances and how we as a culture must adapt. After all, without the people there will be no process in the technology.
At the NRF a new initiative was announced where the NRF Foundation and retailers are working together to help educate the workforce of the future, to give them the necessary tools and skill sets they need to find new opportunities, so that they can adjust to the ever-changing landscape of the retail industry and technology. Because as people adjust to the technological breakthroughs that are upon us, there must be adjustments made by all.
Time to Rise Up
“Innovation in retail is really everybody’s opportunity.”-Mark Parker, Chairman, President and CEO Nike, Inc.
Mark is 100% right! Whenever there is innovation there is opportunity and automation and the other technological breakthroughs upon us are no different. For every position that is lost because of innovation a new one or two may be created. The key is to make sure that the workforce of the future has the skills and tools necessary to be able to adapt and adjust innovations in all facets of our everyday lives.
“Today’s jobs require new skills.”-Bill Brand, HSN.
Considering Bill’s insight, the NRF Foundation, in cooperation with retailers all around the world, has introduced an initiative called “Rise Up.” Rise Up is a training and credentialing program that will help people acquire the skills and training they need to secure the jobs of the future in retail and give them the skills they need to advance in the retail sector.
The future of the retail industry is very closely knit to advancements in technology and the future is now upon us. And the Three Musketeers (Technology, People and Process) must make sure they all work together as this is truly a time in history when it’s “All for One and One for All.”