To provide understanding during this uncertain time, we are monitoring the impact of coronavirus on online consumer behaviors. See the latest data on our Covid-19 eCommerce Impact data hub.
As countries and cities open up again, or move to the next phase of their post-Covid plan, consumers everywhere are reconnecting with what it means to go into a non-essential store to make a purchase. We’ve been paying attention to digital shopping behaviors this past week (and since early March), to understand how the Coronavirus crisis has impacted online activity and businesses across industries.
We’ve analyzed more than 10 billion sessions — monitoring traffic, transactions and customer engagement — to see how the unfolding situation has affected digital business. To understand these changes, we’ve compared data from each week with the period immediately preceding the introduction of social distancing and store closures in the West (or, the first 6 weeks of the year, which we call the reference period).
This is what we observed this past week:
Traffic Goes Down For Fifth Consecutive Week But Transactions Remain Strong
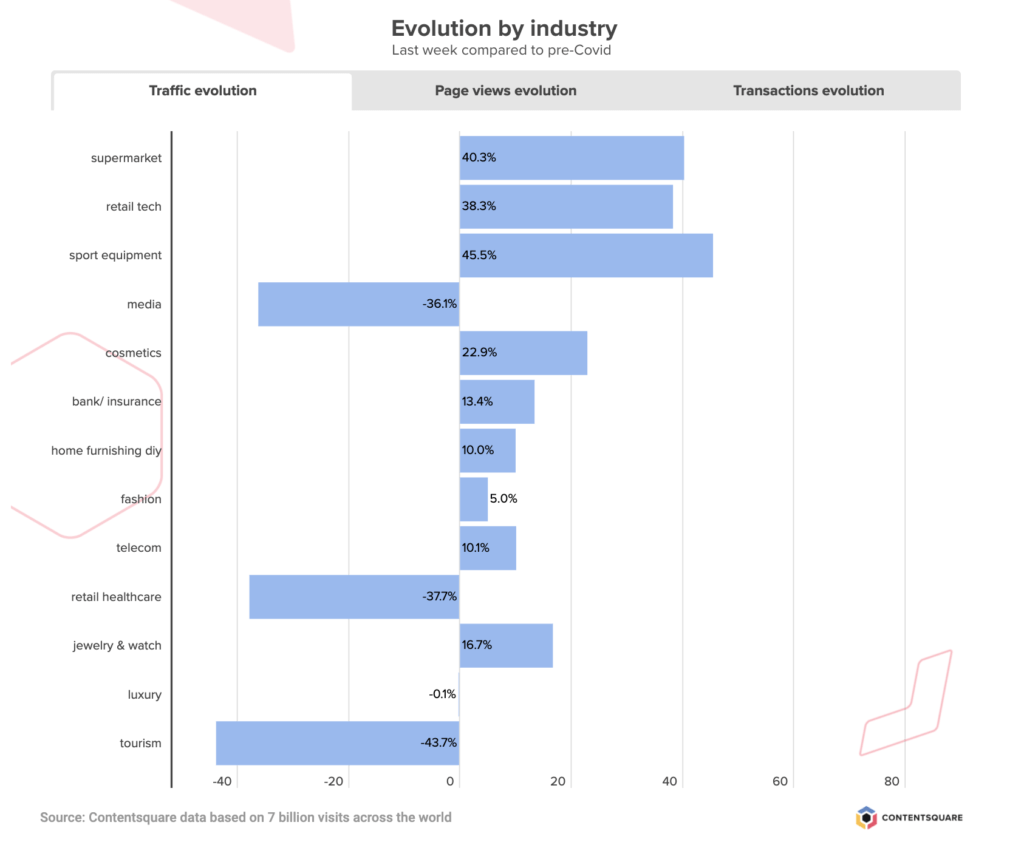
Global digital traffic has been decreasing steadily since mid-May (coinciding with the first wave of store reopenings in Europe), with a new -4% drop in the volume of visits this past week. This puts digital traffic today at +6% pre-Covid levels, although a breakdown by industry shows that some sectors are still seeing up to +45% more visitors than back in February.
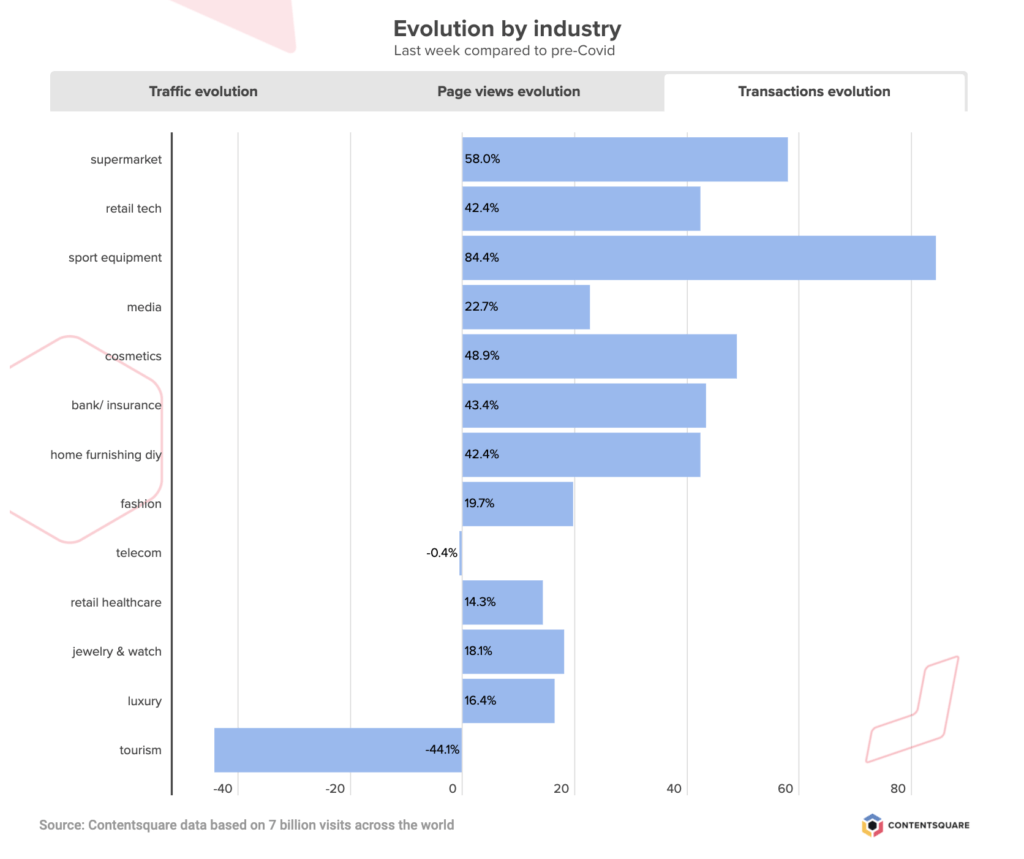
Transactions however have not been dropping at quite the rate of digital traffic, with a -3% drop this past week, that does little to make a dent in the +29% transaction increase recorded since the onset of the crisis.
The UK is responsible for the greatest leap in the volume of digital transactions (+63%), while France and Germany have recorded slightly more conservative increases (+14% and +17% respectively). The US numbers are very aligned with the global average, with +28% more digital sales than before the introduction of quarantine measures.
 Traffic to Fashion Sites Stabilizes As Pure Play Businesses Emerge Stronger
Traffic to apparel sites remained steady this past week after several weeks of dwindling digital activity. Transactions were also stable, following a 40 point drop since late May, and the volume of digital sales today is +20% greater than it was before the crisis started.
We also compared traffic and transactions between click-and-mortar and pure play brands, and found that, since reopening, pure players (with no / limited retail) are experiencing more stability with their digital activity. Brands with physical stores are doing slightly better today than their online-only counterparts, but their volume of transactions has been decreasing steadily since late May, while pure play brands appear to be maintaining the increase in sales week on week. As of now it certainly looks like digital-only brands are emerging stronger from the Coronavirus crisis, particularly when you consider that for these storeless brands, extra traffic and transactions are net gains while for retailers the surge of online business was there to compensate for the drop of retail activity.
Grocery Sector Loses Traffic But Digital Sales Still Strong
Online grocery traffic continues on its downward trend, having steadily decreased since the massive surge in the third week of March and a more discreet peak in early April. This last week brought a -13% drop in the volume of traffic to grocery sites, but despite this latest decrease, the sector is still enjoying +40% more visits than before the first social distancing orders. And while transactions may have dropped -15% this past week, the global volume of online grocery transactions is still +58% higher than before the start of the crisis.
The breakdown by country reveals different dependencies on digital for food and household staples with France almost back at its pre-Covid levels of digital grocery transactions, the US at around +50% more, and the UK in the lead with more than double the number of sales. As other non-essential businesses open their doors, it will be interesting to see how a ‘return to normal’ shopping habits impacts the collective reliance on online grocery stores.
Tourism Sector Still On The Road To Recovery
Traffic and transactions on travel sites went up +7% this past week, marking another week of growth for the sector that has suffered the most since the start of the crisis. This latest positive chapter makes a small impact on the sector’s digital activity, and globally, travel sites are still experiencing -43% less traffic than it was back in February, and are recording -44% fewer transactions.
France is catching up faster than any other country we analyzed, and is today seeing -20% less traffic than it was before the start of lockdown and -25% the number of transactions. The US is the country that has suffered the biggest drop in visitors although interestingly, transactions are picking up faster in the US than in the UK, despite the UK boasting more traffic.
Have you registered for Summer Camp yet? We’ve put together a six-part series for adventurous experience-builders looking to capitalize on the summer months to fast-track their digital transformation. Join us for our next campfire session with Walmart, to explore common digital challenges and how best to tackle them (A/B Testing merit badge, anyone?).
Impact of Coronavirus on eCommerce: The Mother’s Day Edition (Update 10)
To provide understanding during this uncertain time, we are monitoring the impact of coronavirus on online consumer behaviors. See the latest data on our Covid-19 eCommerce Impact data hub.
With the traditional Mother’s Day brunch and other celebratory outings out of the equation this year, many have turned to digital to source gifts for their mom(s), who may well be in need of some extra appreciation these days! Jewelry and beauty brands are decking out their homepages with special Mother’s Day gift guides and promotions (shoutout to Aesop’s three key mom lessons homepage banner), and the internet is blooming with lists of small businesses you can support with your Mom-Day purchases right now.
As we do every week, we’ve analyzed billions of online sessions across 900 websites to understand gifting behaviors in particular, and to see what trends are unfolding across all industries this week.
To understand the impact of the crisis on traffic, transactions, pageviews, and more, we’ve compared data from the past week to the period immediately preceding the global reporting of the outbreak (or, the first 6 weeks of the year, which we call the reference period).
Here’s what we surfaced this past week:
Mother’s Day Spending Drives Transactions in Beauty, Jewelry and Luxury Sectors
According to an NRF survey, consumers in the US are slated to spend a record $26.7B on gifts for their mom(s) this year, with the average Mother’s Day budget nearing $205. The study, which is based on a survey of 8,000+ adult consumers, also singles out jewelry as the top gifting category.
This explains the +5% increase in visits to jewelry sites this past week in the US, and the 19% boost in the volume of transactions. The luxury sector appears to have also benefited from the collective Mother’s Day gifting enthusiasm, recording +6% more traffic than in the previous week and a massive +33% surge in the number of transactions in the US.
And judging by the +12% jump in US traffic to beauty sites, paired with an +11% increase in purchases, the country’s tired, homeschooling moms could well be in for some well-deserved self-care next weekend.
In fact the beauty sector has seen steady growth since early April, with +33% more global digital traffic today than since mid-February. Transactions in the sector have more than doubled over the past two months, while engagement (time spent per session) has remained steady.

![]()
Luxury Market Continues Digital Recovery
After a significant drop in February and March, luxury site traffic has been climbing back up for the past five weeks, and is now at -14% pre-Covid19 levels. After initially dropping by -40% in March, transactions have made a strong recovery and the latest surge has brought them to +36% pre-Coronavirus levels.
In terms of transactions, the hard luxury sector is faring better than soft luxury (+150% and +25% respectively), although their traffic patterns are comparable. High end luxury has also shown more resilience when it comes to purchases (+80% from pre-Covid19), while affordable luxury has only just climbed back up to pre-Covid19 levels.
Despite recent growth, this remains a modest performance when you compare luxury to adjacent sectors such as fashion and cosmetics, where digital is compensating more for the pausing of brick-and-mortar commerce.
Steady Growth Overall As Digital Continues To Be The Only Store
Traffic overall continues to grow steadily (if slowly), with a +2.5% increase compared to +2% the previous week, and +7% the week before that. This steady growth over the past two months has resulted in a +29% increase in the number of site visits since before lockdown.
The volume of global cross-industry transactions has grown by +48% since the first quarantine orders in the West. After a bit of a pause the previous week, transactions were up again by +3.6% the week beginning 4/27.
And after an initial period of rapid growth, the conversion rate has now stabilized at around +15-20% above normal, pre-Covid19 levels.
If you want to see KPIs for your industry, be sure to check out our Covid-19 eCommerce Impact Data Hub. It’s updated every Monday with the freshest behavioral data across all sectors.
Impact of Coronavirus on eCommerce: Telco & Consumer Electronics Sectors Experience Strong Digital GrowthTo provide understanding during this uncertain time, we are monitoring the impact of coronavirus on online consumer behaviors. See the latest data on our Covid-19 eCommerce Impact data hub.
As we turn to digital to complete all the tasks that once upon a time required venturing out into the world, going into the office, or heading to the stores, digital has become a cornerstone of the new quarantine lifestyle and economy.
We’ve captured and analyzed 7.3 billion actual digital user sessions since the first stay-at-home orders in the West to understand how Covid-19 is impacting various industries and reshaping digital customer behaviors. To do this, we tracked visits across 37 billion site pages, on more than 900 websites in 26 countries.
To understand the impact of the crisis on several key KPIs (traffic, transactions, pageviews, and more), we’ve compared data from the past week to the period immediately preceding the global reporting of the outbreak (or, the first 6 weeks of the year, which we call the reference period).
Here are some of this week’s findings:
Telco Sector Tops Traffic Increase Table This Week
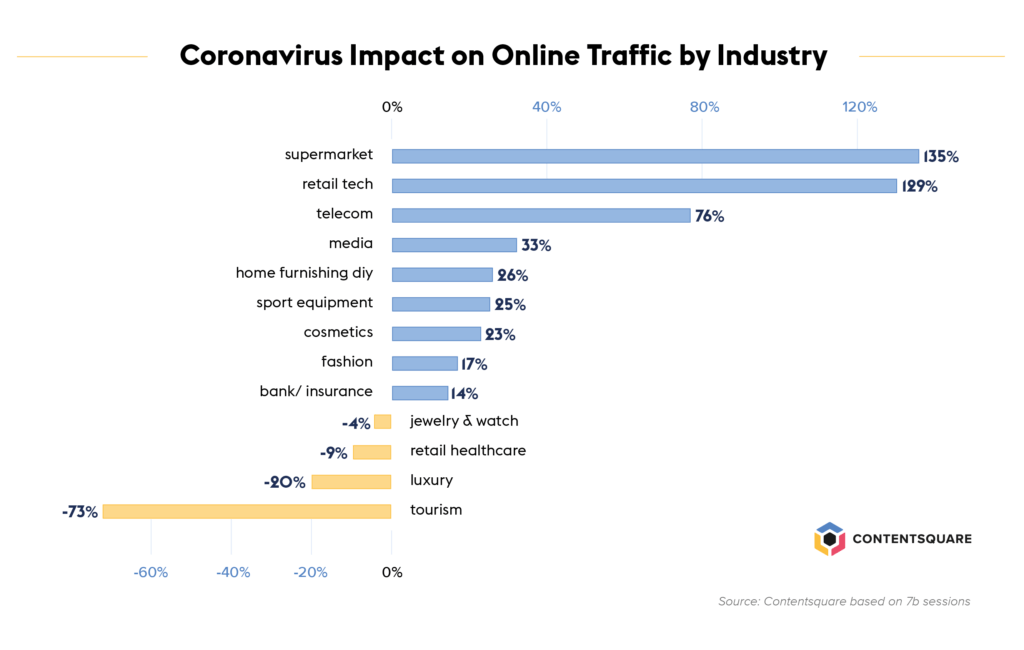
Telecommunications companies are at the heart of the shift to remote, and this past week saw a massive +32% increase in traffic from the previous week. This latest week of growth means the sector is today seeing +76% more visits than it was pre-pandemic.
The latest data shows that traffic to sites selling general telco products such as contracts and phone devices are up +40% above normal traffic. However, transactions have not budged much since March. Hardware vendors and other specialists (second hand, devices and phone cases) have seen less traffic than before the start of quarantine in the West, but a doubling of the volume of transactions.
Consumer Electronics Brands Record Biggest Traffic And Purchase Increases In The US
Consumer electronics sites have recorded strong, steady growth since the start of the crisis. Traffic today is more than double the pre-crisis level, and visitors are consuming twice as many pages. Just this week, the sector recorded a +15% increase in the volume of traffic, contributing to a hefty +128% surge in visits since the onset of the outbreak.
These companies are doing well globally, with the DACH region leading both in traffic (x2.4 the pre-outbreak average) and transactions (x3.5). Transactions almost doubled in France, and increased by x1.5 in the US and x1.3 in the UK. In fact, the volume of purchases globally has almost doubled in the past month, although it appears to have peaked and stabilized last week.
Traffic has grown faster than transactions, though, and despite a spike in late March, the conversion rate has dropped to 15-20% below the pre-Coronavirus average, suggesting many consumers are window-shopping only.
If we look at the breakdown of product categories, we see that video games and consoles are the most popular items in the US, UK and France, with refrigerators in second place in the US and UK. And while UK and US consumers may be looking for additional room to stockpile all those extra groceries, consumers in France put tablets in 2nd place, and audio equipment in 3rd. Tablets are the 3rd most popular product category browsed by consumers in the US, while UK shoppers prefer to look at laptops.
Another thing we noticed when analyzing traffic patterns is that businesses with brick-and-mortar stores are getting more traffic surge than pure-play brands — although the gap in transactions is not as wide. It shows that many consumers who used to shop in store are now browsing these big box websites but perhaps not converting as much as they would offline.
Conversely, pure players have not experienced such traffic growth but conversion rates have increased more, showing these brands are winning market shares from closed stores. Players selling new products exclusively are enjoying a higher surge in traffic than second-hand specialists, but are only doing slightly better when it comes to transactions.
Online Grocery And Healthcare Sectors Are Seeing A Surge In Transactions
This past week saw significant increases in the volume of purchases on grocery and healthcare sites — up +19% and +22% respectively. With traffic slightly down for both sectors this week, it could be that retailers have ironed out supply chain issues, leading to improvement in conversion rates.
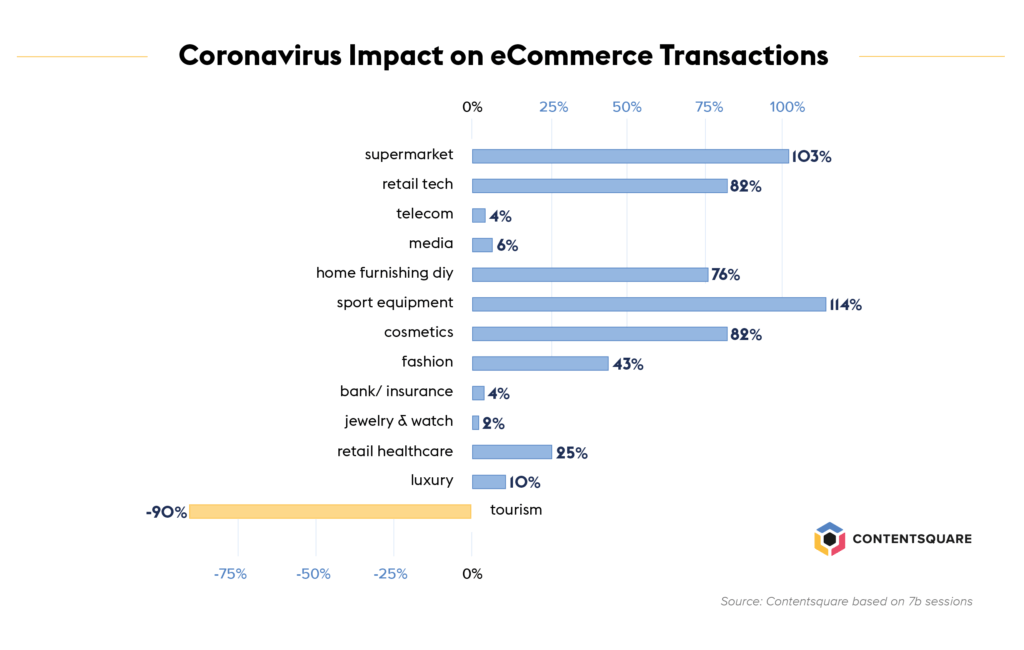
Online grocery has topped the industry chart from the very beginning of the crisis, recording a +135% increase in the global volume of visits and +103% more transactions. This surge is most noticeable in the UK, where traffic is up +199% and transactions have increased by +136%. In comparison, US consumers have clocked in +40% more visits and made +59% more purchases. And in Germany, transactions have only increased by +13% since stay-at-home orders were implemented in Europe.
Join us for our upcoming webinar on Getting Digital Right Today, on Wednesday April 29th, 12pm. We’ll be joined by CX-perts from Monetate, Botify and Medallia for an insights and advice-packed session on all things digital customer experience.
Impact of Coronavirus on eCommerce: New Sense of Hope Drives Sales Up
To provide understanding during this uncertain time, we are monitoring the impact of coronavirus on online consumer behaviors. See the latest data on our Covid-19 eCommerce Impact data hub.
With brick-and-mortar stores and businesses closed in many regions of the world, consumers have refocused their spending habits on digital. Getting things delivered to your door is the hallmark of being a consumer in times of quarantine, and as people settle into the new social distancing norm, many eCommerce sites are seeing an increase from their regular traffic and transactions.
We’ve tracked 7 billion actual visitor digital sessions since the onset of the Coronavirus outbreak to keep you up to date with how the pandemic continues to affect digital consumer behavior. To bring you the freshest, most relevant insights, we’re analyzing visits on more than 900+ websites in 26 countries.
To chart the progression of several KPIs (traffic, transactions, pageviews, and more), we’ve been comparing data from the past week to the period immediately preceding the global reporting of the outbreak (or, the first 6 weeks of the year, which we call the reference period).
Here’s what we found this week:
ECommerce Traffic and Transactions Continue to Surge
Traffic and transactions across industries continued to gain momentum this past week, with visits increasing by +6.8% from the previous week, and transactions recording a double-digit surge of +11%. This represents the second strongest week-on-week growth since the start of the crisis. So how does all this digital buying activity compare to pre-Coronavirus levels? On the traffic side, the incremental increases observed over the past seven weeks translate into a +22.7% hike in the number of site visits. This extra traffic is also resulting in more sales, with transactions increasing by +45.2% compared to pre Covid-19 levels.
If the pace of growth observed in previous weeks indicated a gradual resuming of browsing and shopping habits, the most recent surge clearly shows that consumers have fully adopted an eCommerce lifestyle, shifting many of their typically physical purchases to digital. The trends we’ve observed in the past couple of months very much reflect consumers’ order of priority, with, before confinement started, a first wave of activity driving growth for sectors associated with necessities (grocery, healthcare products, etc). When confinement started, a second wave saw increases in traffic and transactions for the next tier of priority sectors, such as tech equipment, media, etc. We then saw shoppers up their engagement with home/ decor / DIY sites — a consequence of the redefinition of home as office, school, and (only) place to socialize. And lately consumers appear to be returning to sites that could hardly be defined as “necessary,” such as Fashion or Luxury but nonetheless form an essential part of normal eCommerce habits.

![]()
Fashion Sector in Recovery Mode, Encouraged By Aggressive Discounting
Whether people are tired of loungewear or Zoom chic is where it’s at right now, there has been a resurgence of the fashion sector (transactions up +23% last week), partly encouraged by aggressive promotions and sales campaigns. In the US, transactions on apparel sites almost doubled from the previous week (+99%), while globally, volume of sales is up +63% from the start of the crisis. According to our data, consumers are browsing more fashion sites (visits up +24%), viewing more pages (+38%) and spending longer on these sites (+7% time spent) — all signaling greater engagement than before the shutdown of stores.
Luxury Stages A Comeback While Jewelry Sector Growth Suggests Gift-Giving Is Back
It was a good week for luxury globally as well (transactions up +21% in a week), and in particular in the US (+45% increase in the volume of weekly sales). Meanwhile, mass jewelry and watch purchases went up +20% last week (+22% in the US), signifying a widespread return to gifting following weeks of more focused purchasing. It could be that consumers in the US are also preparing for Mothers’ Day, replicating a similar trend to the one observed in the UK in the week leading up to March 22nd (Mothers’ Day in the UK).
Media Among Sectors Experiencing Slowdown While Grocery Sector Stays Steady
After surging late February and early March, the volume of traffic to media sites was down for the fourth week in a row with a sharp -15% this past week compared to the previous week, indicating perhaps that the initial wave of news and information consumption hit a peak and is now on a downward trend.
Like last week, visits and transactions to grocery sites were very slightly down (-3% for both). Globally, traffic and transactions in the digital grocery sector have stabilized over the past two to three weeks at a rather high level (x2.7 pre-Coronavirus traffic levels and x1.7 for transactions). And despite this recent steadying, the grocery sector is still in the lead in terms of traffic growth, with the last two months of lockdown leading to a +167% surge in visits compared to pre-crisis levels.
Travel Sector Sees First Positive Results In Weeks As Consumers Dream Of Escape
It’s no surprise that the sectors hardest hit by lockdown orders and travel restrictions have been the tourism and hospitality industries. And yet, after weeks of bad news, trends finally started to shift this past week. Visits to travel sites grew by +8% over the last seven days, while transactions increased by +24%. And while the sector is still very much in the red (transactions are still at -90% compared to pre-crisis levels), this week-on-week growth indicates consumers are getting a bit more opportunistic, looking ahead and planning future travel. This uptake of tourism transactions last week is particularly strong in the US (+40%) and Germany (+35%), somewhat strong in France and the UK (both +27%) but less acute in Asia (only +7% last week despite the re-opening of some markets)
Travel and hospitality brands have been particularly inventive with their messaging and offering of late, trying to keep customers engaged despite the uncertainty over when normal travel planning might resume. ClubMed resorts have been helping out homeschooling parents with activities to keep the family entertained while one holiday cottage rental site in the UK is encouraging travellers to book their trip two years in advance.
Join our webinar this week, How the Coronavirus is Impacting the User Journey: Connecting with Users in the Stay-At-Home area. In this webinar, we partner with the digital experts at Multiplica to bring you the freshest data on customer behavior in lockdown, as well as tips on how to create a meaningful brand experience during these trying times.
Impact of Coronavirus on eCommerce: Transactions Peak as Digital Becomes the Only Store (Update 6)
To provide understanding during this uncertain time, we are closely monitoring the impact of coronavirus on digital consumer behaviors. Find all the latest insights on our Covid-19 eCommerce Impact data hub.
After weeks of browsing for necessities only and preparing their homes for weeks (months?) of quarantine, consumers everywhere are resuming some of their normal buying behaviors. And with non-essential stores closed indefinitely in many western countries, digital is providing most of the answers to customer needs today.
We have captured and analyzed billions of user sessions since the beginning of the Coronavirus outbreak, and have been sharing week-by-week updates on the latest trends in consumer behavior across industries.
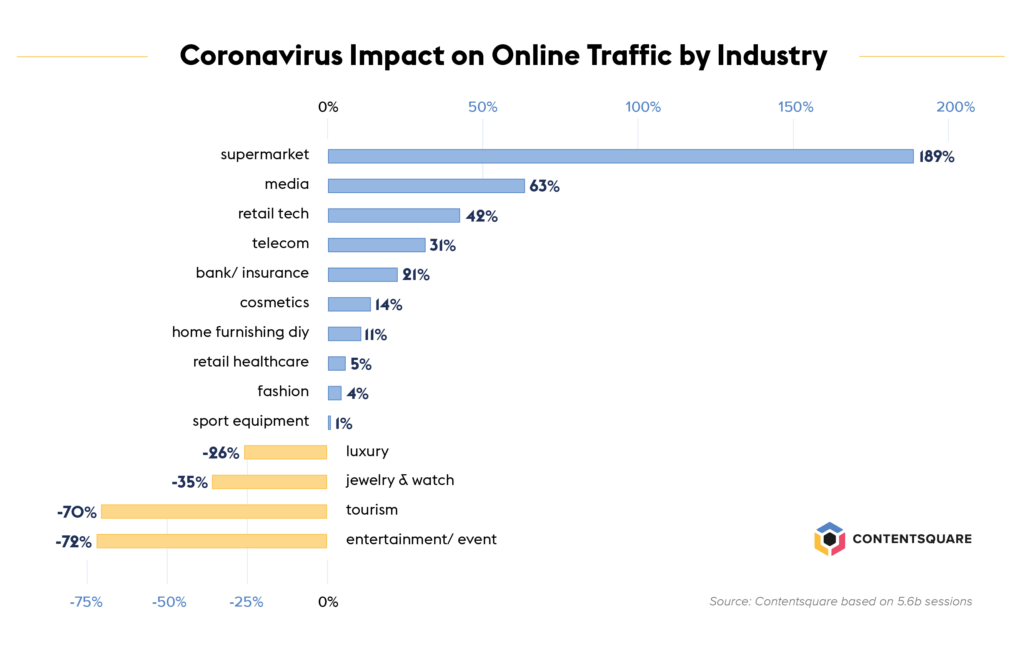
Our study includes more than 5.6 billion sessions and 27 billion page views, captured over the last 14 weeks of 2020, from January 6th 2020 to April 5th 2020. To understand how Covid-19 is affecting global eCommerce, we’ve compared recent weeks to the period immediately preceding the global reporting of the outbreak (or, the first 6 weeks of the year, which we call the reference period).
In last week’s update we wrote about the surge in traffic and transactions recorded in the grocery sector, but also the increases observed across KPIs in the fashion industry.
These are the trends we recorded this week:
Traffic and Transactions Surge as eCommerce Habits Resume
Total visits across all industries were up +3.2% last week from the previous week, contributing to a +10.3% increase since the very start of the outbreak (or, reference week). We also recorded a +18.0% surge in transactions in the last week, bringing the total increase in the number of transactions since the beginning of the crisis to +32.6%.
What does this tell us? That after dedicating the first few weeks of home quarantine to procuring the most basic of necessities — starting with food and health items, and then moving on to home office and fitness equipment — consumers are now resuming some of their normal shopping habits.
And with non-essential brick-and-mortar stores still closed in many places, digital has shifted from convenience to necessity when it comes to making routine purchases. With traffic and transactions remaining steady or increasing across many of the verticals we analyzed, we are observing digital compensate for the pausing of offline retail.
Impact of the Coronavirus on digital traffic since the beginning of the outbreak:
Impact of the Coronavirus on digital transactions since the beginning of the outbreak:

Home Decor and DIY Sectors Get Digital Makeover
Faced with the prospect of several more weeks at least of home quarantine, many consumers spent some of their time and budget this week on improving — or at least thinking of improving — their pad.
Some have found it hard to stare at their apartment or house all day without itching to make improvements, and consumers clocked in +46.8% more hours browsing furniture and DIY supplies since the start of the oubreak. This is the greatest increase in browsing time recorded across all industries.
Last week in particular saw a sharp increase in the volume of visits to websites from this sector (+22.8%). Many consumers last week hit purchase on items to upgrade their home office or living space, with a big +52.3% increase in the number of transactions compared to the previous week. In fact, this collective enthusiasm for home improvement and furniture has caused transactions in the Home Decor/DIY sector to more than double since the beginning of the outbreak (+101.4%).
The sector also recorded a +82.6% increase in the conversions rate — one of the largest rises observed across industries.
Grocery Store Supply and Consumer Demand Align
Visits to grocery sites were down for the first time in six weeks, dropping -9.3% last week compared to the previous week. But despite this slow down, overall traffic volume has grown a massive +189% since the beginning of the outbreak.
Meanwhile, transactions were up +19.6% last week from the previous week, contributing to an +80% increase since the beginning of the outbreak.
The combination of this slight dip in visits and increase in purchases could signify that customers are slightly more realistic this week about the delivery slot situation (scarce!), and are perhaps more accustomed to and willing to agree to product substitutions. Grocery stores everywhere have risen to the challenge of increasing consumer reliance on home delivery, and have come up with innovative ways of managing shifting customer behaviors.
Grocery sector: Traffic (Index 100: pre covid-19):
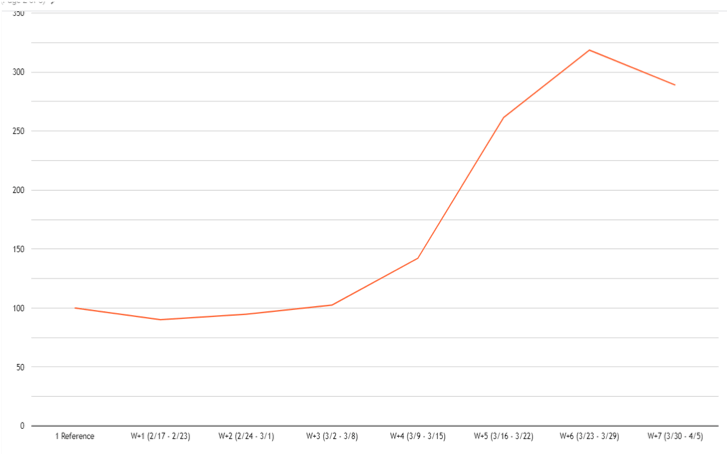
Grocery sector: Transactions (Index 100: pre covid-19):
And Then There’s Tiger King
While visits to TV/Streaming sites have grown a healthy +25.2% since the start of the crisis, transactions have escalated +125.9% as consumers look for alternatives to in-person socializing.
Interestingly, last week, both transactions and visits were down since the previous week (-16.8% and -12.5% respectively) — perhaps reflecting the fact that many consumers have now picked out and signed up for the subscription services/Netflix shows that will get them through quarantine.
Beauty Sector Sees a Spike in Visits and Transactions
As consumers resume some of their eCommerce routines (and run out of face cream or their favorite shampoo), personal care purchases are once more a thing, following on the heels of a bit of a resurgence two weeks ago. This renewed interest also reflects the way many players in the beauty industry have been focusing their promotions and homepage campaigns on hand soap and other necessities.
In fact, the Beauty and Cosmetics sector recorded an impressive +24.3% increase in visits last week compared to the previous week, coupled with a +36.7% surge in transactions. This contributes to a whopping +106.1% boost in the number of transactions since the start of the outbreak, for a modest +14.2% increase in the volume of visits.
Cosmetics / Fashion sectors: Traffic (Index 100: pre covid-19):

Cosmetics / Fashion sectors: Transactions (Index 100: pre covid-19):
Moving Up the Maslow Pyramid of Needs
The Fashion sector recorded a second week of growth in the volume of transactions (+20% compared to the previous week). This sector is now above pre-Covid-19 levels with a recorded +22.9% increase in the number of transactions since the start of the oubreak.
There seems to also be light at the end of the tunnel for the Luxury and Watch /Jewelry sectors, with transactions still below normal but up last week by respectively +18.5% and +53.5%.
At the top of the Maslow pyramid of needs, it is worth noting that the Tourism and Events sectors are still completely amorphous with -90% dip in the number of transactions compared to our reference week.
Luxury / Jewelry sector: Traffic (Index 100: pre covid-19):

Luxury / Jewelry sector: Transactions (Index 100: pre covid-19):
![]()
We will keep monitoring the data over the coming weeks to bring you timely updates on how events are impacting various sectors. In the meantime, sign up to our upcoming webinar, Showing Up For Your Digital Customers (Apr 15 @ 1PM ET) — a discussion around how to adapt to consumers’ fast-changing needs with our Head of Strategy Jean-Marc Bellaiche and special guests from Kohl’s.
Feature image by stokkete
Valentine’s Day: French Grocery Shoppers Prefer Romantic Meals Over Flowers
In the days leading up to Valentine’s Day, we decided to take a closer look at digital grocery sales in one of the most romantic countries in the world: France. As it turns out, the way to the hearts of the French is through fine cuisine, as romantic dinners for two both dominated in click rates and drove the highest revenue.
We analyzed how visitors behaved when browsing common Valentine’s Day products including flowers, chocolates, champagne and dinners for two.
Leading the pack, the romantic dinner category yielded a click rate of 5.7% (versus only 1.96% for flowers), suggesting many couples across France are planning to stay in on Valentine’s Day and celebrate with a home-cooked feast.
A close second was the Champagne category, which drove at 4.18% click rate. And yet despite driving more clicks than the chocolates category, bubbles generated 60% less revenue than sweet treats, suggesting lovers across the country will be skipping straight to dessert and perhaps avoiding a hangover this year.
If you’re interested in all things Valentine, check out our gifting report.

A guest post by Lillian Xiao, a user experience designer for a large European automaker.
Automakers are designing the next generation of cars with user experience (UX) at the forefront. The merging of physical and digital—driven by electrification, connectivity, self-driving technology, and fluid ownership models—will give rise to unprecedented user experiences. The most successful automakers will bring technologies and services together in ways that are usable and delightful for the end customer.
In the future, cars will resemble our smartphones more than they’ll resemble the cars that we know today—machines composed of gears, fluids, and thousands of moving parts. Instead, cars will be connected devices on wheels, part of a large, complex network of people, devices, and infrastructure. Automakers are already bracing for this transition, where digital blends with the physical, and user experience will become increasingly important to help people navigate the world.
Industry 4.0: A blend of digital and physical
The physical world around us will become more digital and connected in what experts are calling the 4th industrial revolution, or industry 4.0. Cars are just one example of how this transformation is taking place. We can measure this by looking at how many lines of code cars have today. Two decades ago, cars had on average 1 million lines of code. Today, cars have 100 million lines of code. Experts predict that before long, cars will have at least 200 million lines of code.
For automakers, the increasingly digital framework poses new challenges. A major challenge for established automakers is bridging two vastly different production cycles from the automotive and software domains. Today, a car can take anywhere from 2 to 5 years to go from concept to production. However, software development cycles are fast and iterative, constantly introducing new features and replacing old features that no longer meet user needs.
The discrepancy is most obvious in today’s in-car infotainment systems. User interfaces come in and out of fashion quickly, which means that digital infotainment systems can become outdated by the time cars are introduced to market. The result is that infotainment systems are routinely ranked as the least satisfying feature for car owners. Among other things, this discrepancy reflects the challenges that large automotive companies—also known as original equipment manufacturers (OEMs)—face in transitioning to a new era of mobility.
Automotive UX
For the automotive industry, new technology paves the way for new models of mobility. While software competence is the necessary first step, mobility will eventually be about usability, trust, and delight. UX may become the differentiating factor for cars in the future.
User experience has its origins in the software industry. At its core, UX is about designing solutions that meet human needs, often through the medium of technology. Oftentimes, technological solutions are introduced to a market, only for its creators to discover that there’s a mismatch in the market, product, or simply wrong timing.
In this way, UX provides a user-centered approach, as well as a set of practices, for automakers to test new concepts and solutions across a blend of new digital, physical, and service offerings.
Near-term automotive trends and UX opportunities
How can automakers take a user-centered approach to fuel innovation in the auto industry? Below, I explore four areas of near-term growth—based largely on public discussion around these topics—and look briefly at how UX can help automakers identify opportunities for innovation.
1. Electric cars become more affordable
As battery components become cheaper, electric vehicles (EVs) will become more affordable. Bloomberg predicts that in 2025, worldwide EV sales will reach 11 million, and in 2030, EV sales will reach 30 million.

The experience of driving an EV is—or perhaps should be—considerably different than driving a car with an internal combustible engine (ICE). Unlike gas-powered cars, many EVs have single-pedal driving (without the need to switch gears), faster acceleration, and simpler car maintenance (without the upkeep of a complex system of gears and moving parts).
In reality, technology never advances in isolation, which means that entire ecosystems will emerge around EVs. Vehicle charging infrastructure is just one example of this. It takes much longer to charge an EV than to fuel a gas-powered car, which creates opportunities to help drivers make use of this idle time. UX can help us understand things like where drivers prefer to charge their cars, and what drivers want to do while their cars are charging. Today, I see Tesla owners waiting in their cars at the edge of shopping mall parking lots. As EVs gain wider adopting, the experience of charging will undoubtedly improve from what it is today.

2. Cars become connected digital platforms
A recent consumer report revealed that drivers want their cars to provide the same communication and entertainment capabilities as their phones. Automakers are responding by introducing concepts for large touchscreens, voice recognition, gesture recognition, and heads-up displays to assist drivers in accessing content while driving.
Infotainment systems—the host of in-car features that include music, navigation, and phone integration—has a long history dating back to the first in-car radio in the 1930s. From there, navigation systems were introduced in the 1980s, and the first hard drives and Bluetooth systems were introduced in the 2000s. Recent focus has been on 5G, which many anticipate will provide high-speed mobile connectivity for networked devices in the future.

Byton Interior; Source: Sean O’Kane, The Verge
3. Cars begin to drive themselves
Self-driving technology is already embedded in today’s cars in the form of advanced driver assistance systems (ADAS). Features like adaptive cruise control (on freeways) and automatic parking can help drivers become more accustomed to the idea of semi-autonomous and autonomous vehicles.
Automakers can take these opportunities to educate consumers about the capabilities of autonomous technology, and to design experiences that prioritize trust and safety. A recent AAA study revealed that at least 2 out of 3 drivers using ADAS features report trusting the technology in their cars. Positive experiences can play an important cultural role in helping consumers become more comfortable with self-driving technology.
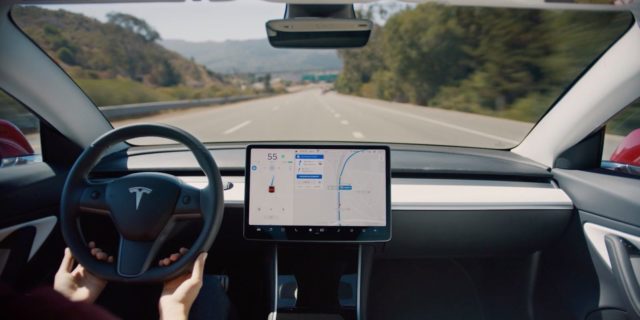
Tesla Autopilot; Source: Electrek
4. Car ownership becomes more fluid
Car ownership has taken on many forms in recent years. Vehicle owners can make a living, or earn extra cash, by using their cars to drive people and goods around. Peer-to-peer platforms like Turo and Getaround allow car owners to rent out their vehicles, and ZipCar allows members to rent from its fleets of cars in half-hour increments. These shared mobility options help car owners and consumers determine the mobility models that work best for them in their own lives.
UX can play a central role in helping automakers understand the user journeys related to different models of shared mobility. For example, understanding a rider’s journey, from booking a ride to leaving the car, can fuel innovation at different steps along the way. With shared mobility, there’s a clear need for innovative experiences that cater to a growing demographic of people who are less interested in owning and driving a car.
Looking to the future & implications for UX
If we assume that technology continues to progress in these four areas—as many automakers and experts believe today—then before we know it, the world may begin to look very different.
RethinkX, an independent think tank, predicts that by 2030, “95% of U.S. passenger miles traveled will be served by on-demand autonomous electric vehicles owned by fleets, not individuals, in a new business model called ‘transport-as-a-service’ (TaaS).”
This seems to reflect what many in the automotive industry are bracing for—conversion to an electric autonomous future. In this future scenario, it may be more practical to be driven than to drive yourself.

RethinkX analysis based on U.S. Department of Transportation data; Source: RethinkX
If these assumptions play out, then UX will play a key role in helping companies provide enjoyable, meaningful, and personalized experiences that merge the digital and physical.
Design Council, an independent charity and advisor to the UK government on design, predicts:
“There will be far more use-appropriate products as we go into the future. You will have less of the kind of car that does everything for everyone, and you’ll have more specific-use vehicles out there. Your day-to-day commute may be answered by the hire car in the city, which isn’t yours; it’s cleaned regularly, it’s there when you need it and it’s just functional. Which means that the car I choose to buy is the car that suits my other needs, whether that’s for family, recreation or holidays.”
The further we look into the future, the more difficult it is to predict user needs. However, it’s clear that UX will become increasingly important for the auto industry moving forward.
If you want to learn more about building future-proof digital experiences for the auto sector, click here.
ContentSquare Launches Augmented Reality Tool for Brands Seeking Instant Digital Customer AnalyticsCS Live Allows Companies to Glean Instant Best Practices Insights in the Time it Takes to Browse Their Site
New York, N.Y. (September 26, 2018) – Continuing to provide marketers and brands with deeper analytics and insights into how and why online users do what they do, ContentSquare, a digital experience insights platform, today announced a new solution – CS Live – that delivers customer experience (CX) information in real-time with one click.
“Because digital is a mission critical channel today, we want to make sure that, for companies we support, key stakeholders can access customer experience insights as easily as they can walk into their brick and mortar stores, and observe where customers are going, which display they are looking at, where they hesitate, where they might experience frustration, etc. In particular, we believe senior executives needs to access this data directly, without needing to rely exclusively on expert analysts,” said Jonathan Cherki, CEO and Founder of ContentSquare. “Relying on a handful of experts is neither efficient nor scalable. Enterprises — many of which are overwhelmed with data — need to make their website optimization decisions based on insightful experience data that drives conversions instead of on their gut feeling.”
Now, by simply downloading ContentSquare’s CS Live browser plugin from the Chrome Web Store, users can browse their respective sites for instant CX analytics. With CS Live, entire teams can easily access customer experience insights, get answers to their CX and visitor engagement questions as quickly as it takes to browse their website, and complement their existing website testing strategies. From CEOs to analysts, internal teams can now benefit from advanced CX and visitor engagement analytics with no training required.
“CS Live helps GoPro immediately identify engagement metrics without having to load and sift through reporting data – this reduces time required for analysis and accelerates our decision making process,” said Eumir Nicasio, Head of Product, Digital & eCommerce of GoPro.
“Universally, web users have grown to have zero tolerance when it comes to searching for and receiving information online,” added Jonathan Cherki, CEO of ContentSquare. “CS Live is a practical solution for brands seeking immediate feedback – like Amazon one click buying or Uber one click taxi – on how customers are utilizing their sites. We refer to it as AR analytics because it augments your site with actionable behavioral metrics that can be understood and shared across teams, enabling a true democratization of data. It’s a bit like having a real-time performance review with your website. CS Live has an array of use cases, from a conversion manager needing answers as to how her visitors are engaging with a new checkout process to an ecommerce manager inquiring about which piece of content has generated the most revenue on his company’s site, even in a particular region like France, that month.”
CS Live can be used to perform side-by-side site comparisons and discover how a brand’s A/B test strategy drives customer engagement. It can also be used to analyze dynamic content and influence content marketing strategies. Allowing for deeper insights, CS Live can also easily attribute customer experience KPIs from engagement to return on investment (ROI) for all active content elements. Further, it does not require a tagging plan, and is compatible with ContentSquare’s zone-based heat maps to compare and contrast content performance regardless of where the content is placed on the site or what device was used to view or access it.
ContentSquare is a digital experience insights platform that helps businesses understand how and why users are interacting with their app, mobile and web sites. They compute billions of touch and mouse movements and transform this knowledge into profitable actions that increase engagement, reduce operational costs and maximize conversion rates. Using behavioral data, artificial intelligence and big data to provide automatic recommendations, ContentSquare empowers every member of the digital team to easily measure the impact of their actions and make fast and productive data-driven decisions to optimize the customer journey. ContentSquare offers its services to a range of companies including Walmart, L’Oréal, Tiffany’s, Clarks and Unilever.
For more information about ContentSquare, please visit: contentsquare.com
About ContentSquare
ContentSquare is a digital experience insights platform that helps businesses understand how and why users are interacting with their app, mobile and web sites. We compute billions of touch and mouse movements, and transform this knowledge into profitable actions that increase engagement, reduce operational costs and maximize conversion rates.
Using behavioral data, artificial intelligence and big data to provide automatic recommendations to marketers, ContentSquare empowers every member of the digital team to easily measure the impact of their actions, and make fast and productive data-driven decisions to optimize the customer journey.
Learn more at contentsquare.com.
Contact
Jason Heller
(212) 584-4278
contentsquare@5wpr.com