
How to improve your product detail pages
80+ actionable insights for getting the most out of your PDPs.


The product detail page (PDP) is where your customers come to find out everything they need to know about your products—making it the most valuable page in your entire digital customer journey.
Today, PDPs are leading the way in terms of page consumption. According to this year’s Digital Experience Benchmark Report, product pages are the highest trafficked page type—with 28.4% share of page views on desktop and 30.8% share on mobile.
With customers flocking to your PDPs, optimization and testing has never been more important. A well-optimized product page has the power to boost your conversions, minimize returns and ultimately, increase revenue.
To get inspiration for your product detail page optimization, we asked the digital team at New Look to dish out their expertise. In this blog, we share four experiments that have completely transformed New Look’s page performance, helping to drive additional revenue for the brand.
How to improve your product detail pages
80+ actionable insights for getting the most out of your PDPs.
As high streets reopened post-pandemic, New Look saw a general decline in movement through the funnel from their product detail pages, with a 34% drop off rate between product view and add to bag.
The challenge for Mike and his colleague, Elinor Pierce, Senior Site Optimisation Manager at New Look, was to understand and counter this downward trend. As a long-standing Contentsquare partner, New Look was used to using data-driven insights analyze tests and optimize its digital experience, but the question was where to focus its efforts.
“At New Look, we’re always testing and aiming to improve our website, and Contentsquare has been there helping us to do that since 2019. Naturally, we leveraged the insights that Contentsquare could give us as part of this project, and that really helped us to focus our efforts and work out what to test.” — Mike Hatch, Experimentation Manager (CRO) at New Look
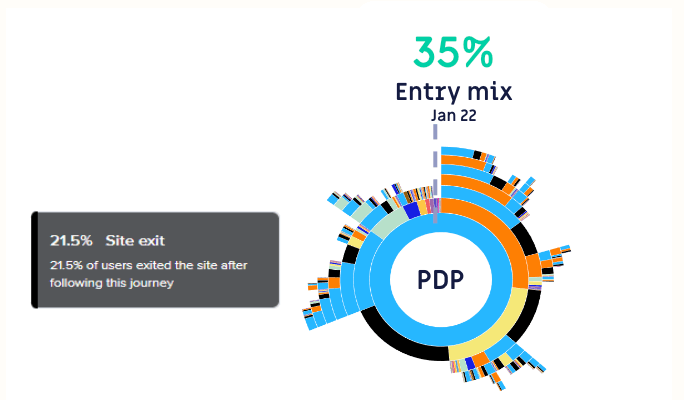
Mike and Elinor leveraged CS Digital to diagnose where their site was losing potential customers.
“Contentsquare’s Customer Journey Analysis capability showed us that we had a high average exit rate of 21.5% on our Product Detail Pages (PDPs). This, and other behavioural insights led us to make a series of small, incremental tests on our PDPs,” Mike says.
In all, they carried out a total of 16 tests on their PDPs, of which three in particular had the greatest impact:
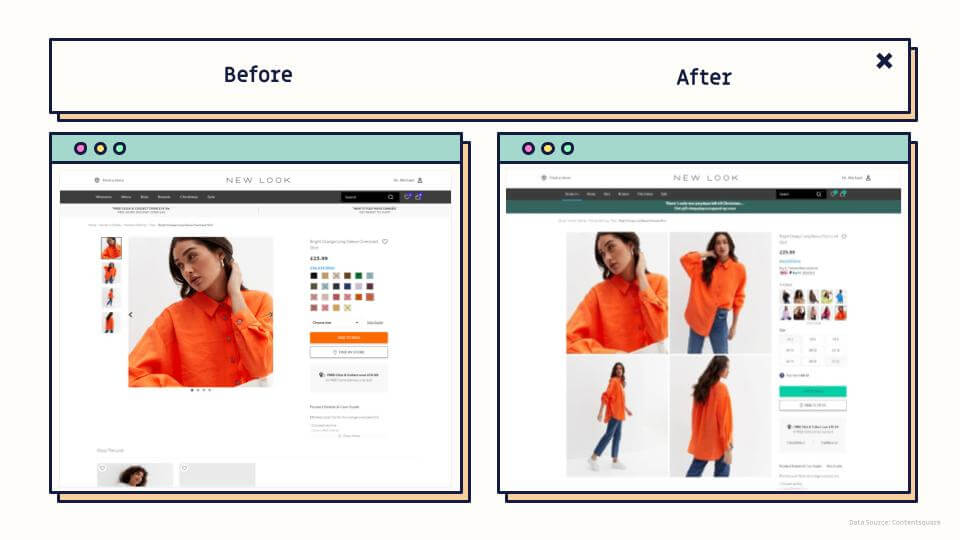
Mike and Elinor hypothesized that testing inline imagery across all devices could improve add-to-bag by 5%. They tested new images that allowed customers to see clothing items from every angle more easily and intuitively.
Analysis of the test results in Contentsquare, showed that their hypothesis was right—inline imagery increased add-to-bag rate by 3.7% on desktop. New Look will roll out the new inline imagery on desktop while continuing to test on mobile.
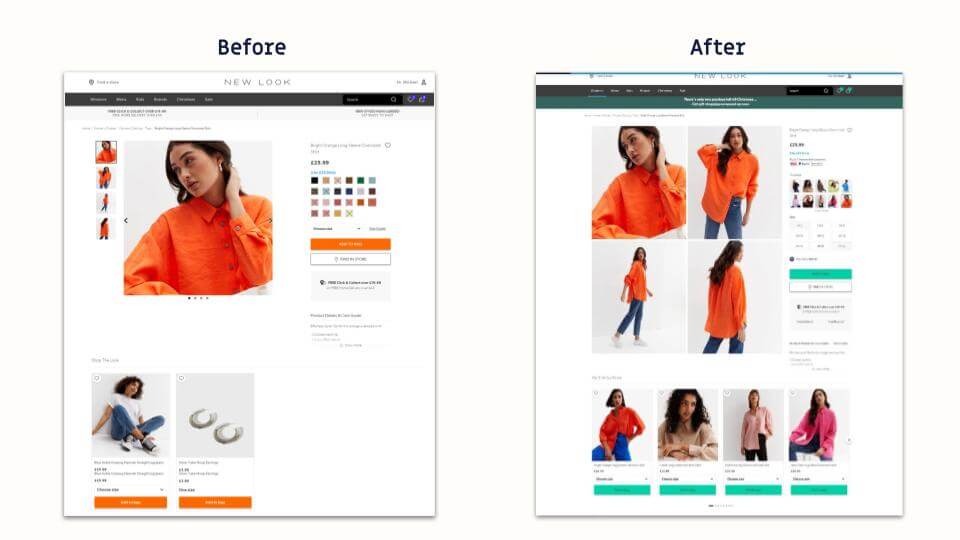
Analysis using Contentsquare’s Zone-Based Heatmaps showed that only 15% of customers engaged with color swatches on PDPs. The team saw an opportunity to optimize these swatches and increase click-through and add-to-bag rate, hypothesizing that replacing the existing simple colored squares with a colour preview of the clothing item would increase add to bag by 1%.
Interestingly, Contentsquare’s Zone-Based Heatmap analysis showed that click-through rates decreased, indicating that customers were able to get a preview within in the same view and did not need to click on images. The new imagery also had a positive increase of +2.7% on desktop add-to-bag rate.
Today, online customers expect to see which sizes of a garment are available at a glance without having to search. Mike and Elinor believed that testing size tiles was an obvious step.
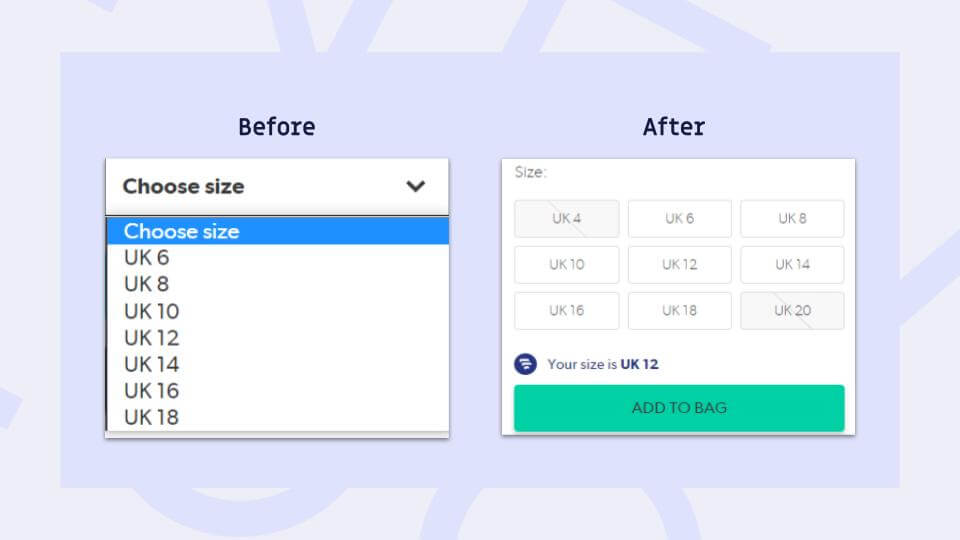
Sure enough, the testing resulted in a +3.9% increase in add to bag. The company is due to release size tiles across the website.
All these small incremental changes have completely transformed New Look’s PDP format. Not only has this improved New Looks online shopping experience overall, but it has helped drive additional revenue for the brand.
“Multiple small increases in add-to-bag rates have made a significant impact on our results,” says Mike.
Mike and Elinor are keen to carry on building on the transformative changes they’ve made as a result of their PDP experimentation.
In particular, the results have inspired a host of new optimizations within New Look’s digital app, and been used as the basis for a website redesign and re-platforming.
New Look’s digital team has developed a full test roadmap based on key questions, such as how PDPs can incorporate sustainability, user-generated content (UGC), and personalization.
“Our PDP tests were developed from Contentsquare’s unrivalled customer insight, driving significant, incremental revenue, and have paved the way for our upcoming site redesign. The results have since inspired and enabled app optimizations, and more importantly, this is just the start. We’ll continue to iterate, helping customers in their mission to find their new look.” — Elinor Pierce, Senior Site Optimisation Manager at New Look

Take a product tour
Get to grips with Contentsquare fundamentals with this 6 minute product tour.