[Infographic] How to measure your user performance

author

Marie Jehanne

June 17, 2021 | 1 min read

Last Updated: Jun 30, 2021

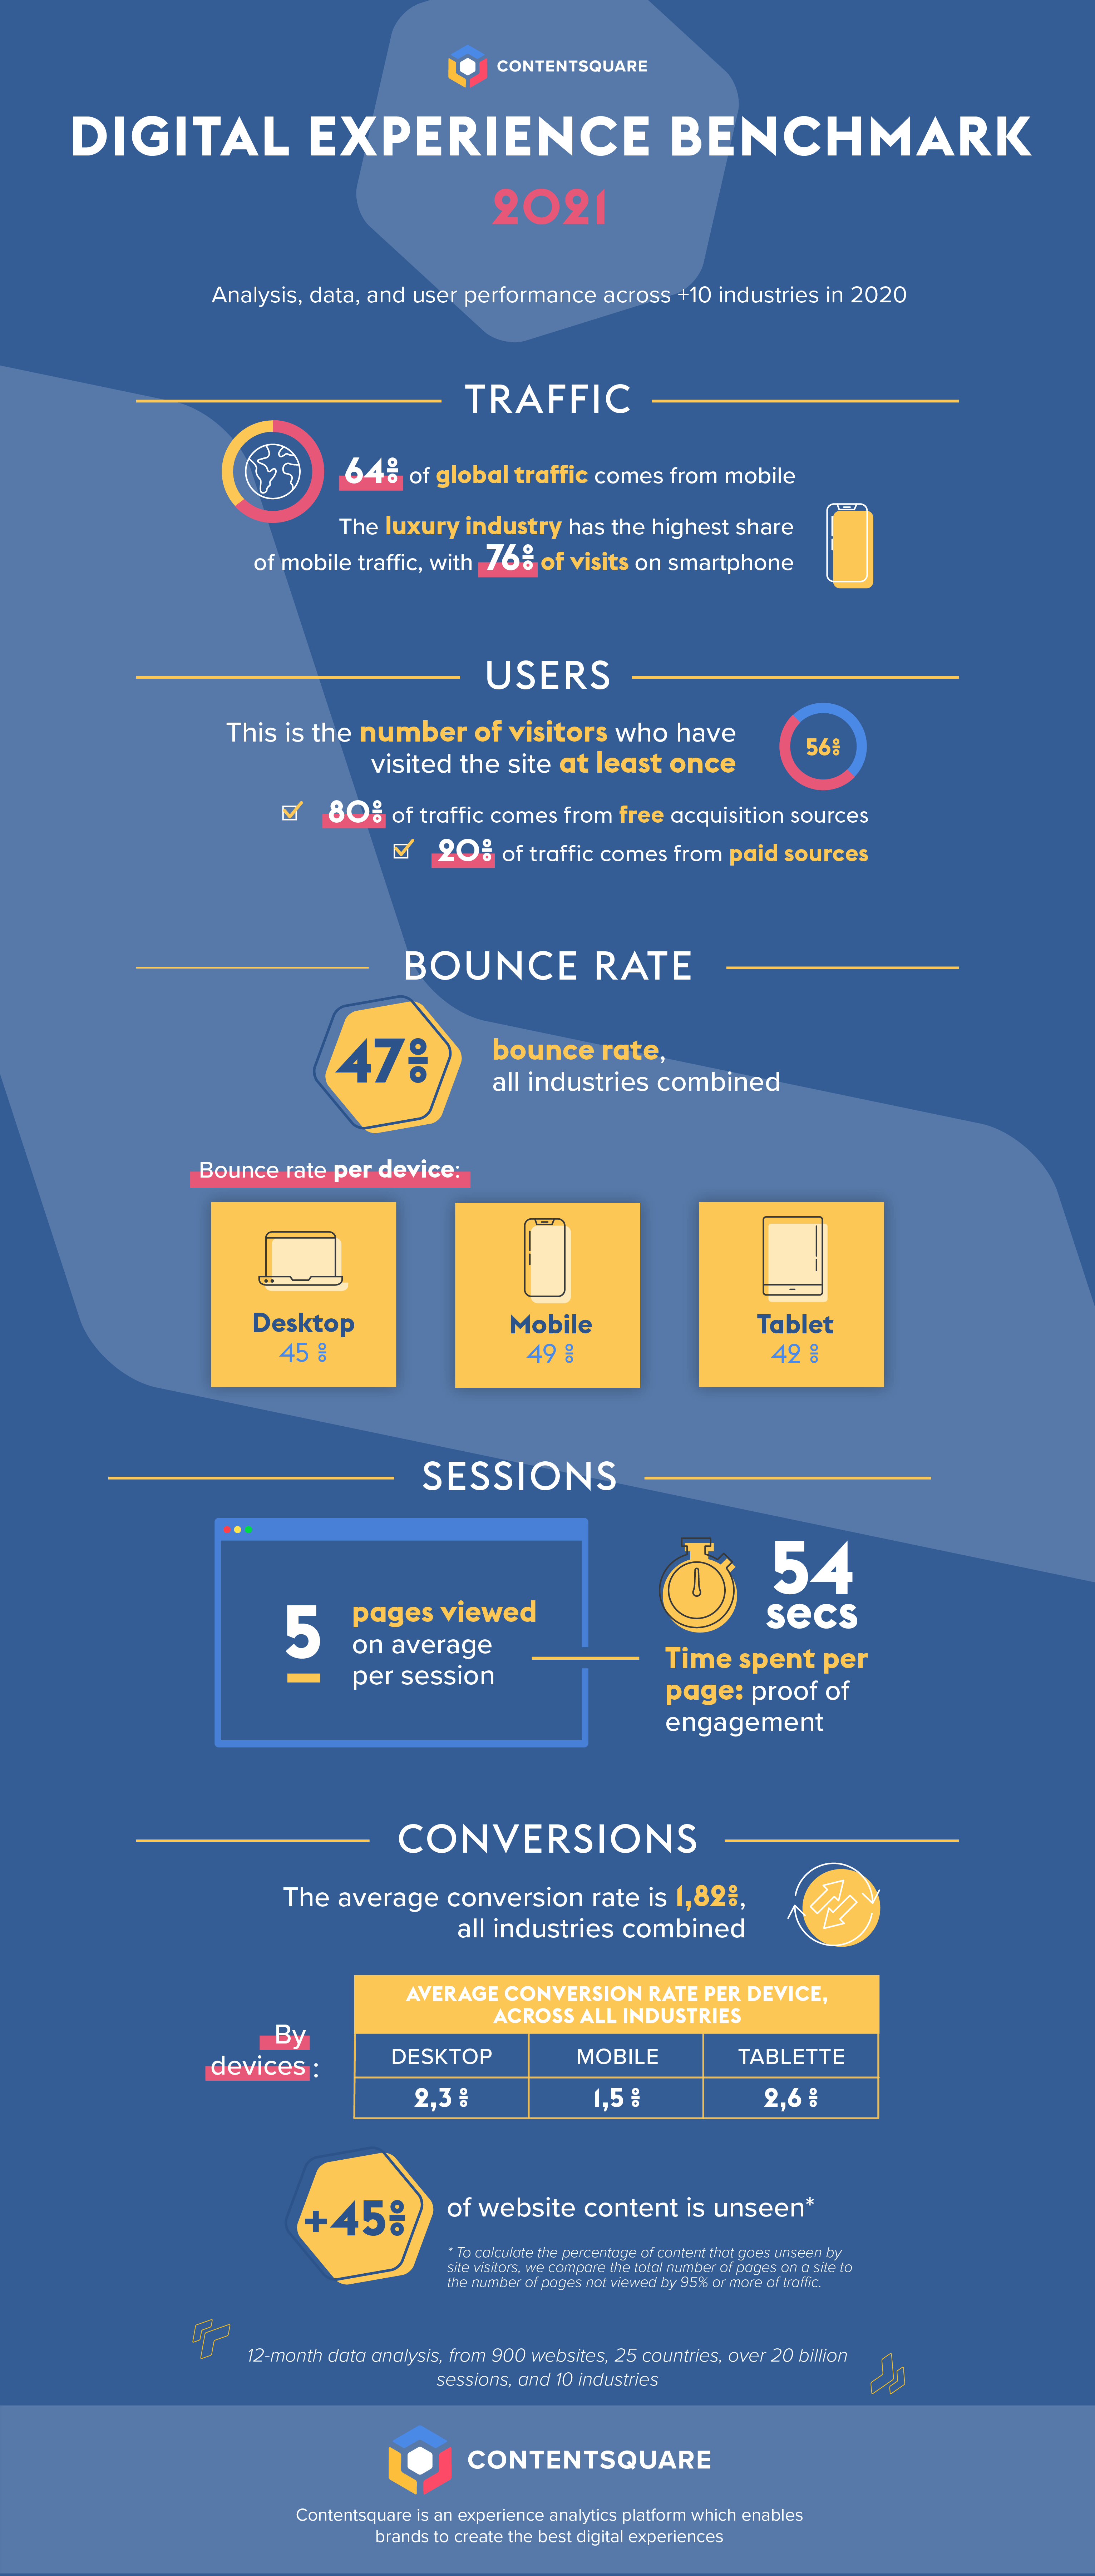
In our 2021 Digital Experience Benchmark report we analyzed over 20 billion user sessions in 25+ countries for 11+ industries. We do this to help you see how your company's digital experience stacks up against the world’s leading brands. 

In the report, we analyzed 10 digital KPIs (bounce rate, time on page, conversion rate, and more) and offered recommendations and quick fixes from our UX-perts and clients. 

🔎 In-Depth Analysis

The 2021 Digital Experience Benchmark

See how your CX stacks up against data based on 20+ billion global user sessions.

Download Now

Improving your customer experience 

This past year has changed how brands view digital experience. With everything moving online, many brands have prioritized their digital experience to acquire new customers and stay competitive.

Personalization, transparency and loyalty are the key factors for this transformation.

To improve your digital experience and differentiate yourself, you need to understand user behavior and performance. With a thorough understanding of what consumers expect from your industry, you will be better equipped to create a positive and memorable user experience.

Highlights from the 2021 Digital Experience Benchmark 

DAB Infography

2021 Digital Experience Benchmark

Download Infographic